High resolution imaging equipment, such as transmission and scanning electron microscopes, can be very sensitive to the environment in which they are installed. Environmental factors including temperature, electromagnetic interference, vibration, and noise must be considered in the design of laboratories intended to house such instruments. With regard to noise, this equipment is often most sensitive at low frequencies, and may have very stringent requirements that extend into the infrasonic range. This presents a number of challenges in the design and construction of the spaces that house these instruments, particularly when forced air ventilation is to be used to control the temperature in the space. These challenges include choosing the appropriate design criteria, the general lack of available low frequency acoustical data for materials, equipment, and commonly available noise control devices, and the relative difficulty of attenuating low frequency noise. Case studies of recently completed imaging facilities are presented, illustrating the challenges and measures implemented to meet the instrument rooms’ acoustic criteria with forced air ventilation. Measured results from tests within the completed spaces are compared to generic acoustic criteria for sensitive equipment in order to illustrate the infrasonic impact of varying the quantities of forced air.
1 INTRODUCTION
The design of laboratories intended to house high resolution imaging equipment, such as those used in nanotechnology, physics, and biomedical research, requires consideration of a number of environmental factors. Instruments such as transmission electron microscopes (TEM), scanning electron microscopes (SEM) and other equipment can be extremely sensitive to temperature and humidity fluctuations, electromagnetic interference, structural vibration, air cleanliness, as well as acoustic noise. Designing a laboratory to house such instruments requires a balanced design that accounts for how all of these various factors relate to one another. This paper presents case studies of completed imaging facilities illustrating the challenges faced and noise control measures required in order to meet very challenging acoustic criteria within various highly sensitive imaging labs, particularly as it relates to infrasonic noise.
2 INSTRUMENT NOISE SENSITIVITY
Acoustic noise can have a significant impact on the performance of sensitive equipment. Low frequency noise creates pressure fluctuations that can excite structural resonances within the instrument, disturb the electron beam directed at a sample, or disturb the sample itself1. Additionally, many sensitive instruments will be installed on vibration isolation systems such as air springs that may themselves be sensitive to acoustic pressure fluctuations2. In devices such as TEMs and SEMs, excessive noise can cause straight lines to appear wavy or images to become blurry or disjointed.
The impact that acoustic noise has on an instrument is dependent on not only the level but also the frequency content of the noise. An instrument will typically be more sensitive at frequencies around the structural resonances of its internal elements. Equipment noise sensitivity is also dependent upon the amount of sound isolation provided by enclosures within the instrument. Therefore, a specific acoustic criterion should be developed for each model of instrument. The lower bounds of noise criteria for various sensitive instruments are shown in Figure 1, in comparison to previously proposed generic noise criteria3 for sensitive instruments. Use of generic criteria is often advisable when designing or evaluating a space, particularly when the specific instrument to be used is unknown or may change, to provide a conservative design that accounts for the varying sensitivities of a known type of tool.
The second plot in Figure 1 shows the generic equipment criteria in comparison with the NC criteria, curves typically used to evaluate interior spaces with regard to human hearing and comfort. These plots show the dramatic difference between instrument and human sensitivities to noise in terms of frequency range and amplitude. In particular, imaging tools are far more sensitive to low frequency noise than humans, with sensitivities extending into the infrasonic frequency range (below 20 Hz), as indicated by the dashed portion of the curves. Due to this difference in sensitivity, the approaches to designing a space for sensitive equipment are necessarily quite different than when designing for human occupancy alone, as will be discussed in the following sections.
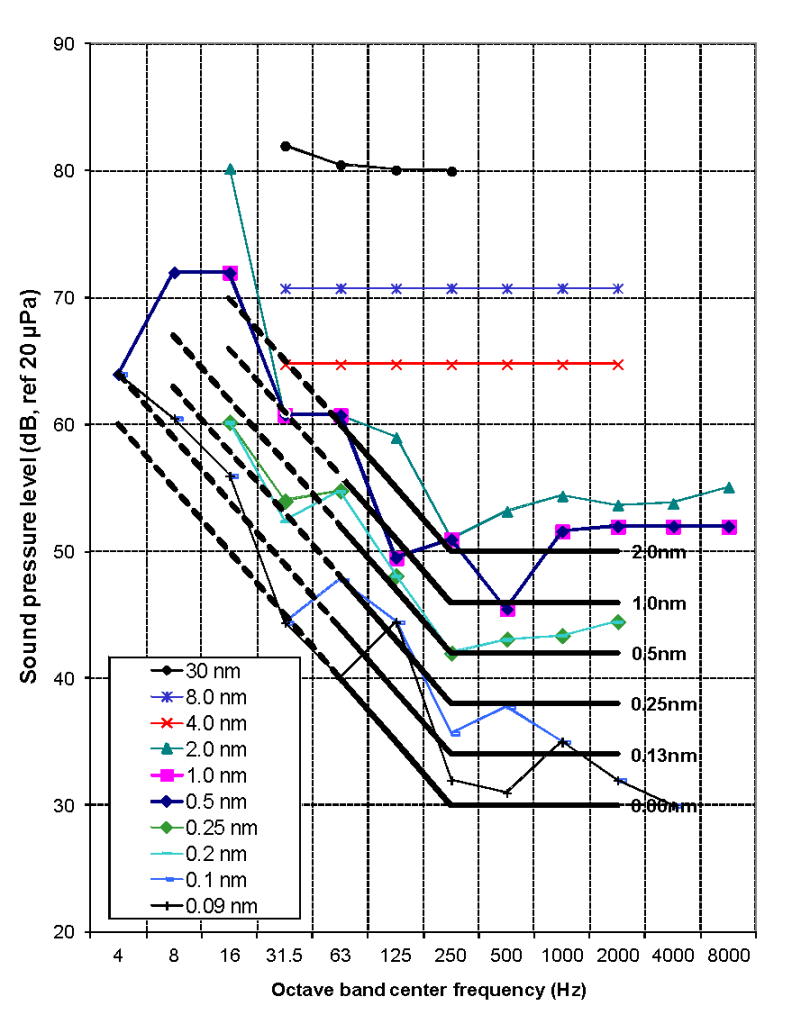
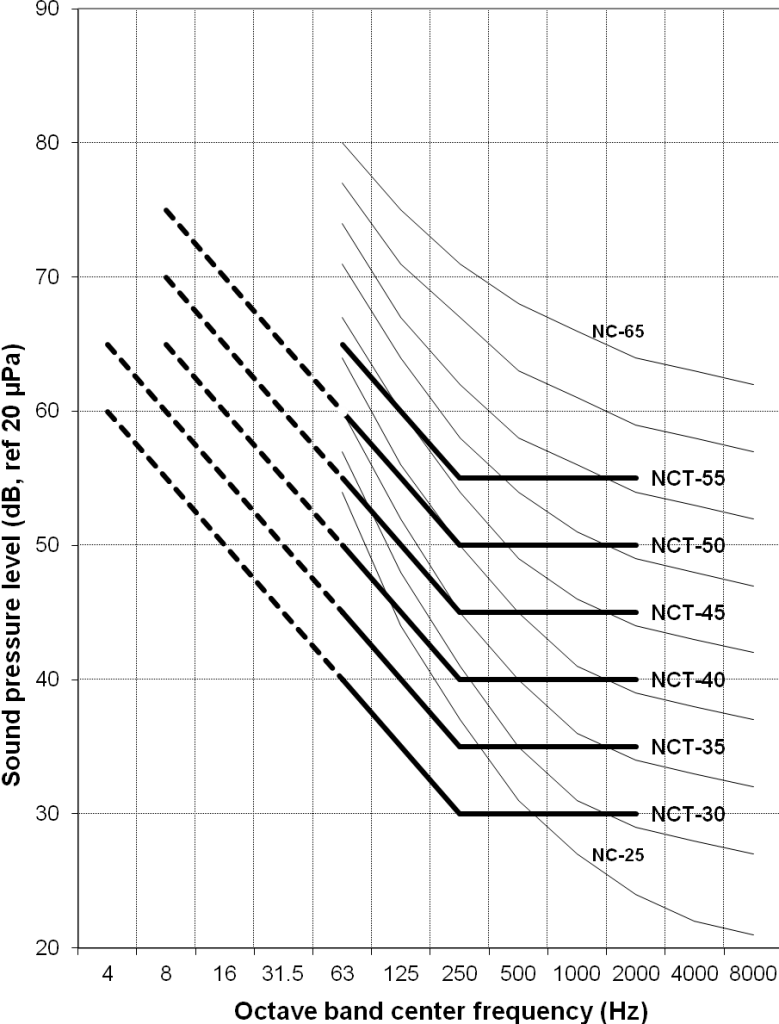
Fig. 1 – Lower boundaries of acoustical requirements for various resolutions of instrument and generic noise criterion curves
3 LOW FREQUENCY HVAC NOISE CONTROL
In this section we will present multiple case studies that illustrate many of the challenges faced and design considerations required to meet low frequency noise criteria for highly sensitive instruments.
3.1 Case Study – Facility A
The use of a forced air system to provide temperature control and ventilation, as is common for most buildings, presents a number of challenges with regard to design for low frequency noise control within an instrument laboratory. Typical analysis of the predicted noise impact on a room from a HVAC (heating, ventilation, and air conditioning) system involves starting with the manufacturer’s measured sound power levels for the fans, factoring in the attenuation provided along the duct path from energy losses and attenuation devices, as well as the additional noise generated by other system components such as variable air valves, diffusers, etc., and then projecting the noise into the sensitive room of concern.4 This type of analysis can be very accurate for frequencies above 63 or 125 Hz, however accurately predicting the noise impact at lower frequencies, particularly down into the infrasonic range, is typically not possible. Sound power data for fans is rarely available below 63 Hz, while data for components such as VAVs are often only available down to 125 Hz. Insertion loss data for noise control products commonly placed in the duct path, such as silencers or duct lining is rarely available below 63 or 125 Hz, and even the data at these frequencies can be somewhat unreliable5. Absorption data for products placed in the room itself, such as ceilings, acoustical panels, etc. is often only available down to 125 Hz.
The lack of available data at low frequencies for such products is a challenge, but is somewhat understandable. The overwhelming majority of building projects involve spaces where human hearing and comfort are the only noise concerns, and thus there is little financial motivation for a manufacturer to test its products below the frequency range at which humans are most sensitive. Accurately measuring sound power, insertion loss, or absorption at very low frequencies is quite challenging, due to the very long wavelengths involved. Providing accurate test data per ISO, ASTM, or other standards6 at these frequencies would require extremely large test spaces and more complicated test procedures, which significantly adds to the expense of testing. An additional challenge is that, even if data were available, traditional sound attenuation measures such as dissipative silencers, duct lining, and room absorption are often relatively ineffective at low frequencies, as the wavelengths can be far greater than the size of the room of concern.
A recently completed suite of TEM and SEM laboratories at a university in the southeastern United States illustrates how traditional noise control measures, along with some best practices with regard to low frequency noise control, can be used to meet stringent tool noise criteria. The instruments proposed in these labs had very demanding vibration, electromagnetic interference (EMI), and temperature/humidity control requirements, along with acoustic criteria extending down to 8 Hz.
The mechanical design for these labs involved a forced air system in order to achieve temperature stability of +/- 0.5 degrees Celsius per hour. The labs were served by two air handling units located on the roof of the facility, with airflow into the space controlled using variable air valves (VAVs) located in the ductwork. A number of measures were implemented in the design to provide the required background noise levels in both the audio and infrasonic frequency ranges:
- Two 3-meter silencers were placed in the both the supply and return duct risers between the fans and the basement labs. The silencers were placed in the ductwork approximately 25 meters apart.
- All ductwork in the basement level was lined with elastomeric foam duct liner. The elastomeric liner was preferred over traditional fiberglass lining due to particulates or contaminants that are often a concern for lab facilities, as well as slightly improved attenuation performance at lower frequencies.
- Variable air valves were placed outside of the room away from the space. This provided as much duct length as possible between the valves and the lab, and provided sufficient room for the installation of additional silencers to control the VAV noise.
- Fabric diffusers were used to provide laminar airflow with low noise levels.
- Acoustical panels were placed on all walls mounted 100mm off of the wall surface in order to increase their low frequency absorption.
- Full height stiff double walls were used for all lab partitions, with massive well-sealed doors. Penetrations for mechanical and other services were kept to an absolute minimum in order to provide maximum sound isolation.
Figure 2 shows the background noise levels measured in one of the most sensitive lab spaces in this facility upon completion, presented in comparison with the noise criterion for the tool to be installed in the space and generic criterion curves7. The background noise levels in the space were measured with the air valves set to allow the maximum and minimum airflow quantities into the space, as well as with the entire air system serving the lab spaces turned off.
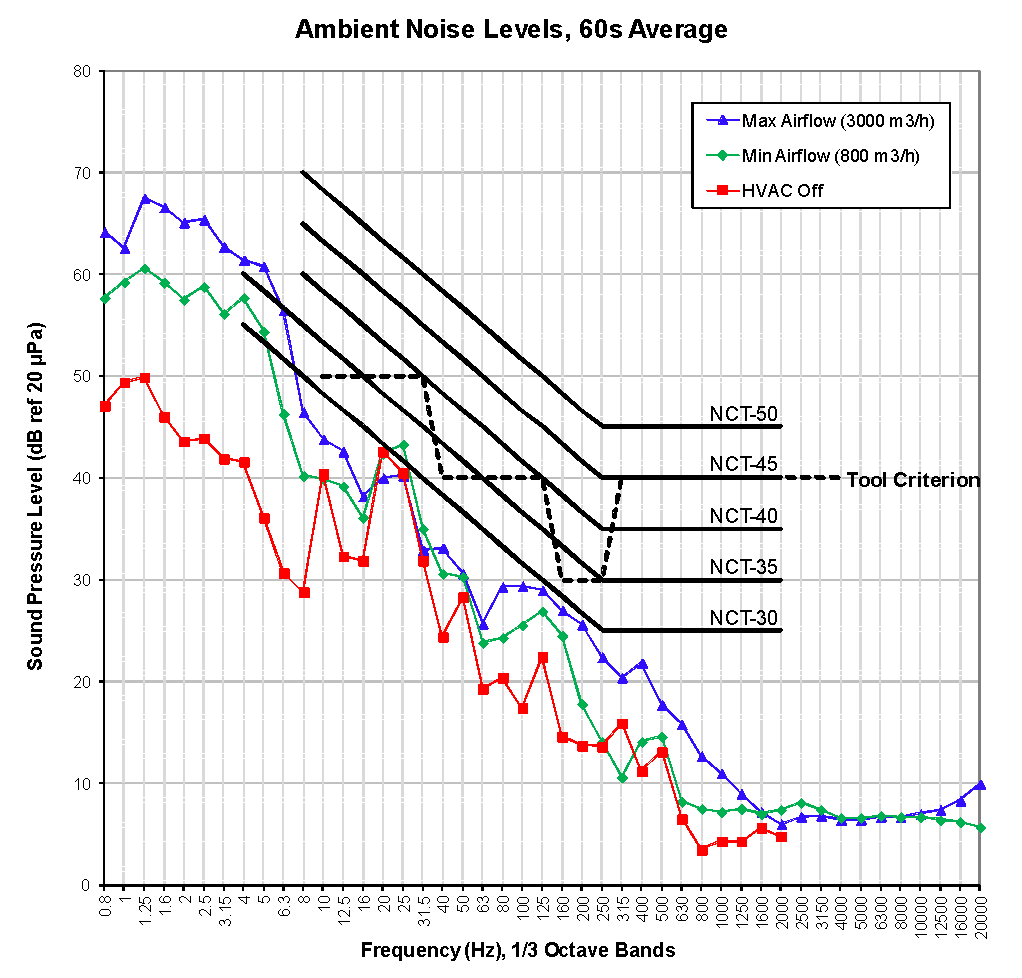
Fig. 2 – Completed Facility A background noise levels
The noise levels at maximum airflow meet the tool criterion at all frequencies, showing that the noise control design approach described above was sufficient to meet the requirements for this lab. There is a significant reduction in the noise levels below 10 Hz with decreasing airflow, with a similar spectral shape but different amplitudes measured in each test.
The results from this study illustrate what is possible with regard to low frequency noise control for a sensitive laboratory when a traditional forced air system is the sole method used to control the temperature within the space. The design required substantial mechanical noise control measures to provide an extremely quiet space, sufficient for the tools to be used in this lab. However, the results also show that, even with this degree of sound attenuation, the simple presence of forced air within the space has a significant infrasonic noise impact, and lower infrasonic noise levels are possible if forced air can be further limited or eliminated. For laboratories with even more stringent infrasonic requirements, additional design considerations are required.
3.2 Case Study – Facility B
Results from a study of a second facility, a suite of highly sensitive physics laboratories located in the United Kingdom, help to illustrate some of the ways in which forced air generates infrasound in laboratory environments, and ways that it can be controlled. The laboratories, which were designed and commissioned by others, were found to exceed the infrasonic noise performance criteria set for the labs. We conducted a series of measurements within these labs to identify the potential mechanism supporting the infrasonic noise, and how it could be addressed.
Figure 3 shows the background low frequency noise levels measured within one of the lab modules of this facility in comparison with the infrasonic noise criterion for the labs, which is 50 dB in one-third octave bands from 2 Hz to 31.5 Hz. This plot also shows the noise levels measured as various mechanical systems serving the lab space and other areas within the building were progressively powered off.
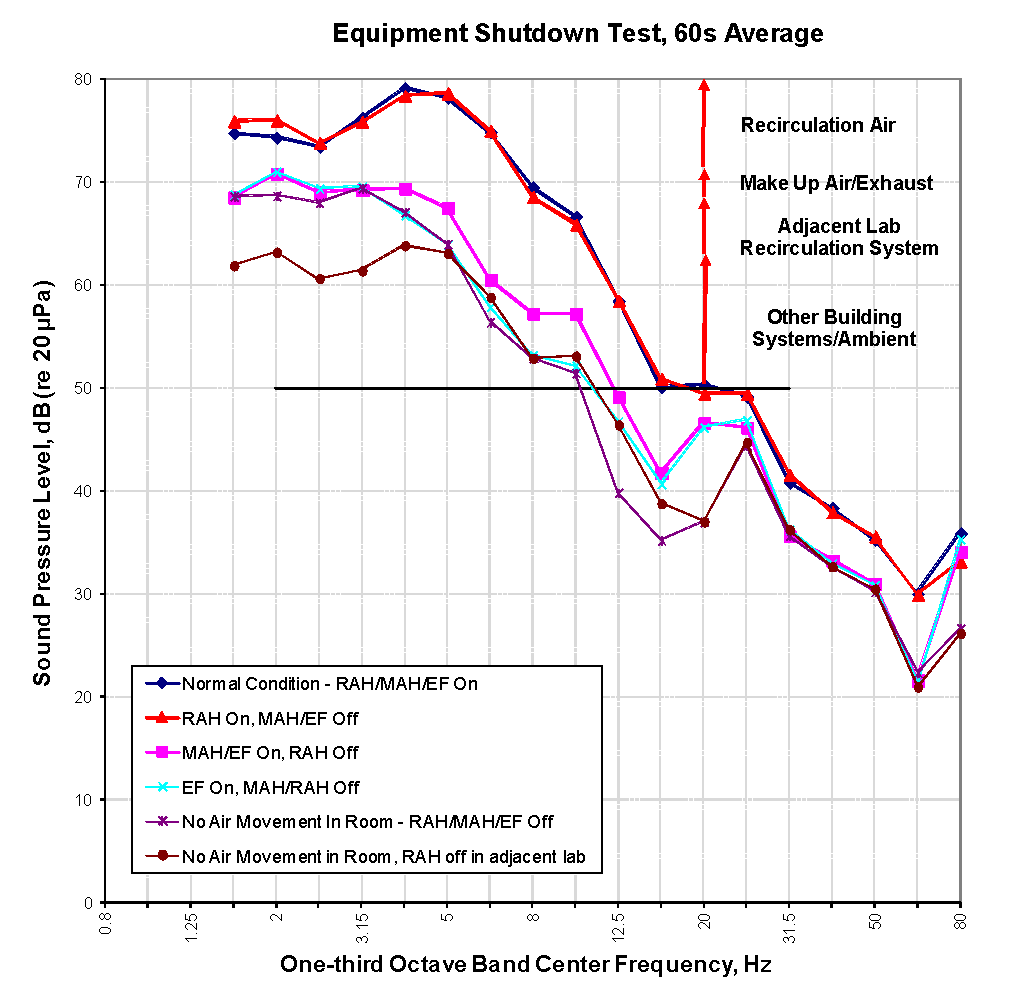
Fig. 3 – Variation in background noise levels in one module of Facility B
As with Facility A, elimination the airflow into the lab space significantly reduces the infrasonic noise amplitude in the space. These results also show that airflow into adjacent labs also has a significant impact on the infrasonic noise levels. The spectra shape in each test remains relatively constant, with a consistent peak at 5 Hz and secondary peak at 2 Hz. Subsequent measurements in additional labs showed that each space had a similar infrasonic spectra shape that remained constant regardless of the amount of airflow into the room, with peaks ranging from 1.6 to 5 Hz.
The peaks appear to be a resonance, which in some cases can be attributed to standing waves or “room modes.” However in this case the frequencies are much too low, as wavelengths from 1.6 to 5 Hz are much longer than the room dimensions. Instead, this resonance is likely due to uniform pressure variations in a volume, such as those inside a Helmholtz resonator.
In a Helmholtz resonator, the resonance frequency fH is most simply expressed by the following:
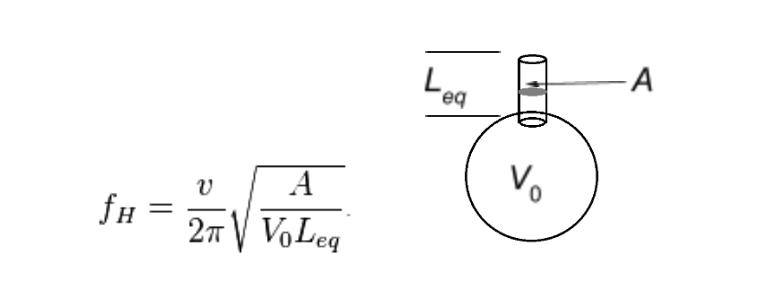
In this equation, V0 is the volume of the resonator cavity, A is the cross-sectional area of the “neck” entering the cavity, Leq is the equivalent length of the neck, with an end correction applied to account for the small area of the neck with relation to the much larger cavity, and v is the speed of sound in air. In this case, the lab space acts as the resonator cavity, with the ducts entering the space and other openings acting as the neck that excites the air resonance within the cavity, as shown in Figure 4. In the figure below the stiff masonry walls and structural slab above are assumed to define the resonating volume, rather than the more flexible lightweight steel wall and dropped ceiling that define the actual room. Increasing amounts of forced air provided a greater excitation of the volume resonance, resulting in higher amplitudes around this frequency. Air serving other rooms likely impacts the space due to a combination of leakage through cracks around doors and service penetrations, and through common duct systems, such as when one air handling unit serves several rooms.
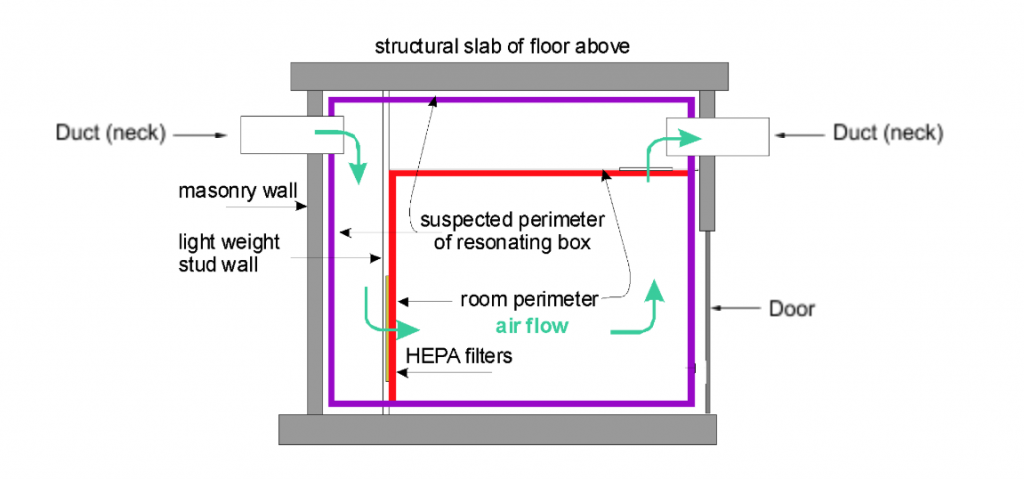
Fig. 4 – Helmholtz Volume8
The Helmholtz effect was further confirmed via a test of spatial coherence throughout the room, which involved measuring sound pressure within the space simultaneously at various locations9. This is a similar approach to the microphone arrays utilized in atmospheric infrasound measurements, which are used to differentiate between an infrasonic plane wave traveling across the earth and noise generated by wind turbulence, etc10. As shown in Figure 5, the sound pressure levels in the infrasonic range (< 20 Hz) were very consistent throughout the space. This is consistent with noise generated by a pressure wave that is uniform across a large percentage of the space, rather than turbulence or another local effect, where some difference in amplitude would be expected throughout the room.
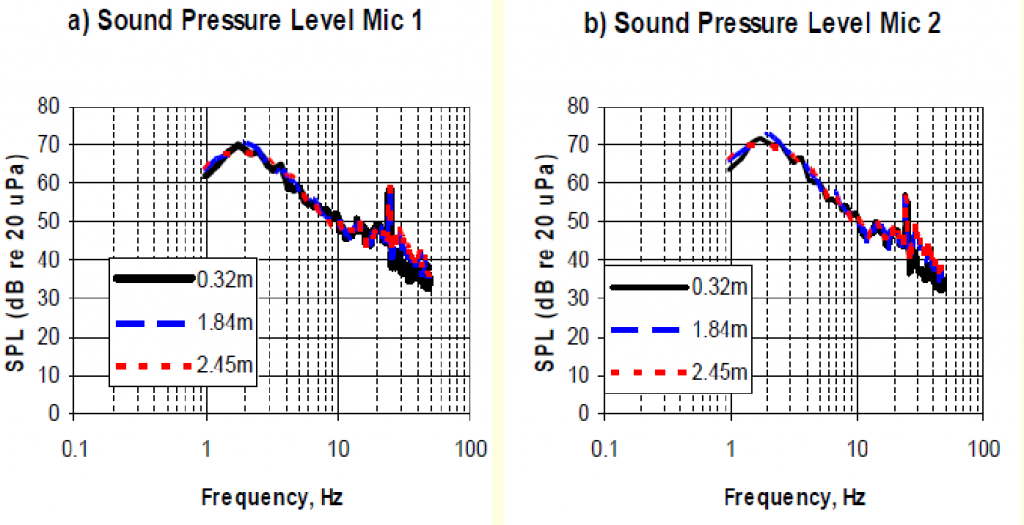
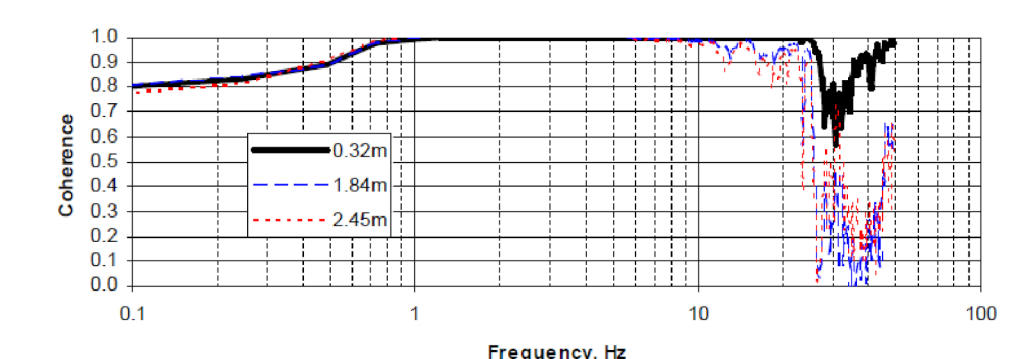
Fig. 5 – Sound pressure levels with microphones spaced at various distances w/ cross correlation analysis
With the lab space acting as a Helmholtz resonator, Equation (1) shows that the resonance frequency will decrease with increasing lab volume and effective neck length, which in this case is the ductwork serving the lab. This relationship points to two areas where the design can be used to help control infrasonic noise. By providing a large lab volume and long duct runs, the resonance of the space can be pushed down out of the frequency range of greatest sensitivity of the instruments.
If the room is acting as a Helmholtz resonator, Equation (1) also implies that the resonance frequency within the space will increase if the cross-sectional area of the openings into the room is increased. This is illustrated in Figure 6, which shows an increasing resonance frequency as the door to the space is opened further, effectively increasing the neck area of the opening into the room.
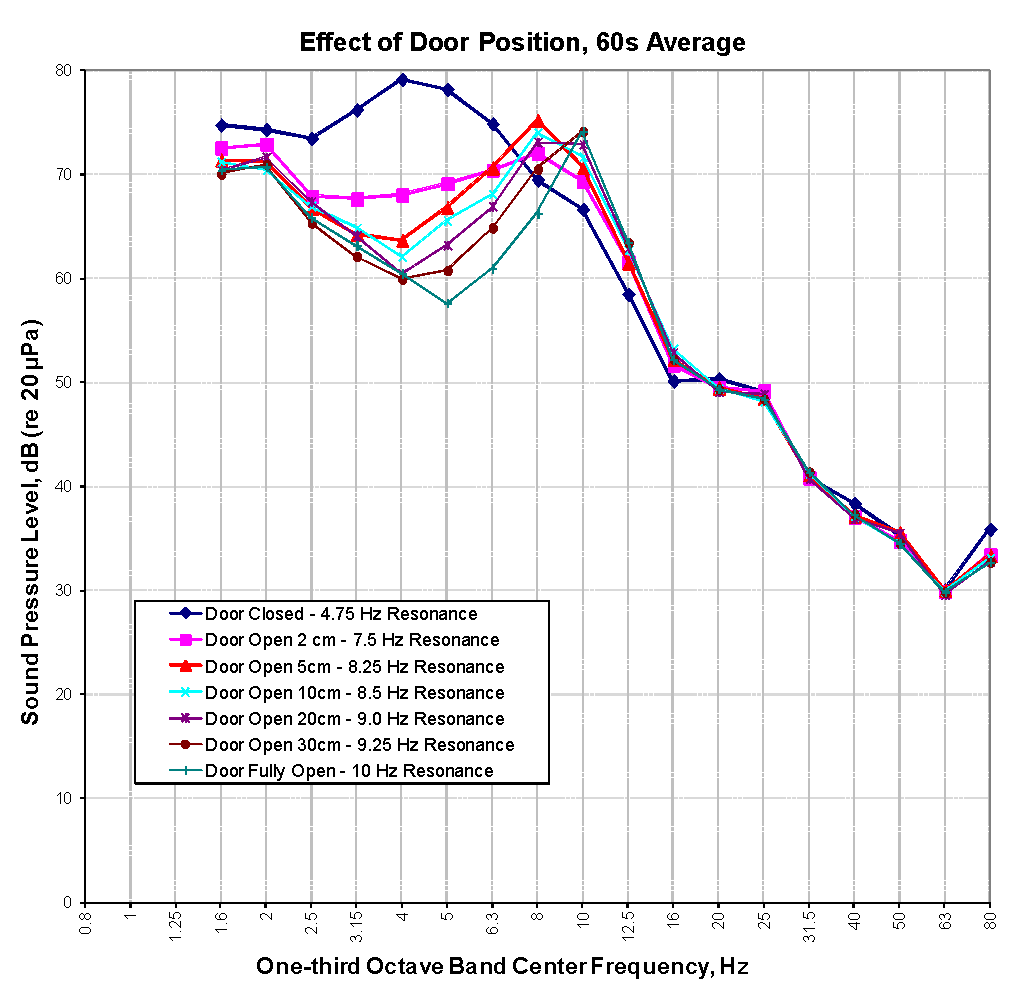
Fig. 6 – Change in resonant frequency from opening door
We also found that light impact to the closed door of the lab very effectively excites this resonance, providing further evidence that the relatively flimsy door participates in the Helmholtz resonance neck area. The door effectively acts as a piston, exciting the room most substantially at its resonance, or at a higher frequency in proportion to any increase in the gap around the door. Partitions, doors, or other components that are not sufficiently stiff and well sealed can act as diaphragms that excite the resonances in the room due to external pressure fluctuations caused by air movement.
One remaining question with regard to this Helmholtz effect is whether the resonance can be excited by sources located completely within the lab volume. Many laboratories have fan coil units (FCUs) that supply additional cooling to offset the heat gains from scientific equipment. We measured the effect of FCU operation on the infrasonic noise levels in two labs within Facility B. These FCUs were self-contained units located entirely within the lab. As shown in Figure 7, we found that there is virtually no difference in low-frequency sound pressure levels with the fan coil units on or off.
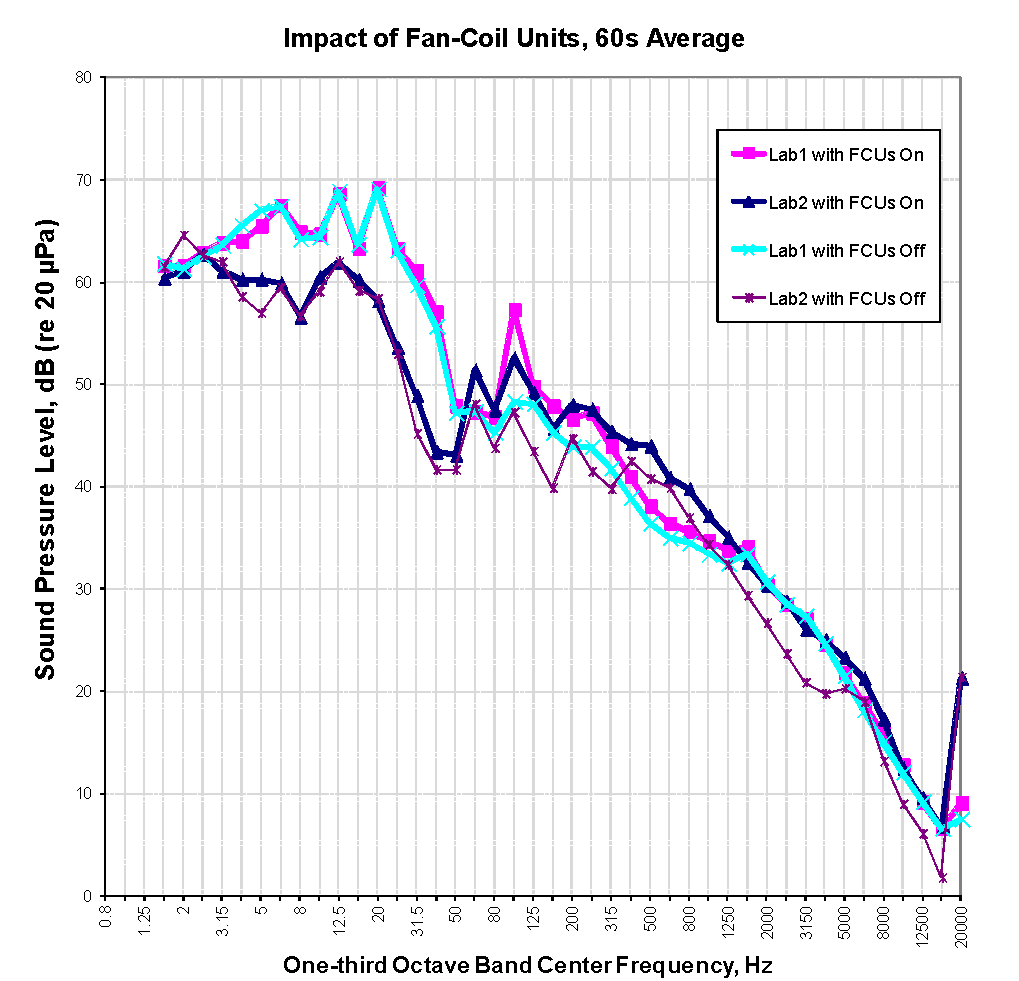
Fig. 7 – Sound pressure level in two labs (served by same fresh air system) with and without fan coil units operating
In these cases the air volume delivered by the FCUs ranged from nearly equal to twice the air volume delivered by the fresh air system (represented by “FCUs off” on the graph). Turning on the fan coil units does not raise infrasonic noise levels, however there are pronounced increases in noise levels at 100 Hz and higher.
The significant difference between the fresh air system and the fan coil unit is that the air handling unit is located remotely, introducing fresh air from outside the resonating box, whereas the fan coil unit is located inside the resonating box. These results suggest that the FCU is not able to pressurize the space with a uniform plane wave from within, the way an outside air system can, and thus do not excite the resonance of the room.
3.3 Case Study – Facility C
The TEM labs in Facility C, a materials science research facility located in the United Kingdom, provide an example of the type of infrasonic performance that can be achieved if many of the lessons learned from the measurements described above are applied in the design. The labs in this facility had similar strict temperature control requirements as those described above, however in this case radiant cooling panels were installed on the walls and ceiling to significantly reduce the quantity of forced air required. Radiant cooling panels, when operating correctly, do not generate significant noise. This reduction in forced air into the spaces minimizes the excitation of the Helmholtz resonance of the space.
Additionally, a large footprint and high ceiling height for each lab was provided to maximize the volume of the space, along with very long duct runs for the forced air that did serve the space, which placed the resonance of the room down well below the frequency range of concern. Extremely rigid walls were provided around the labs, with an inner and outer wall that were completely decoupled from one another, and massive double doors were provided to the spaces. This stiff diaphragm around the space was also designed to limit the excitation of the room by exterior sources.
Figure 8 shows the typical noise levels measured in the Facility C TEM labs in comparison with typical levels measured in Facilities A and B, as well as with the NCT criteria.
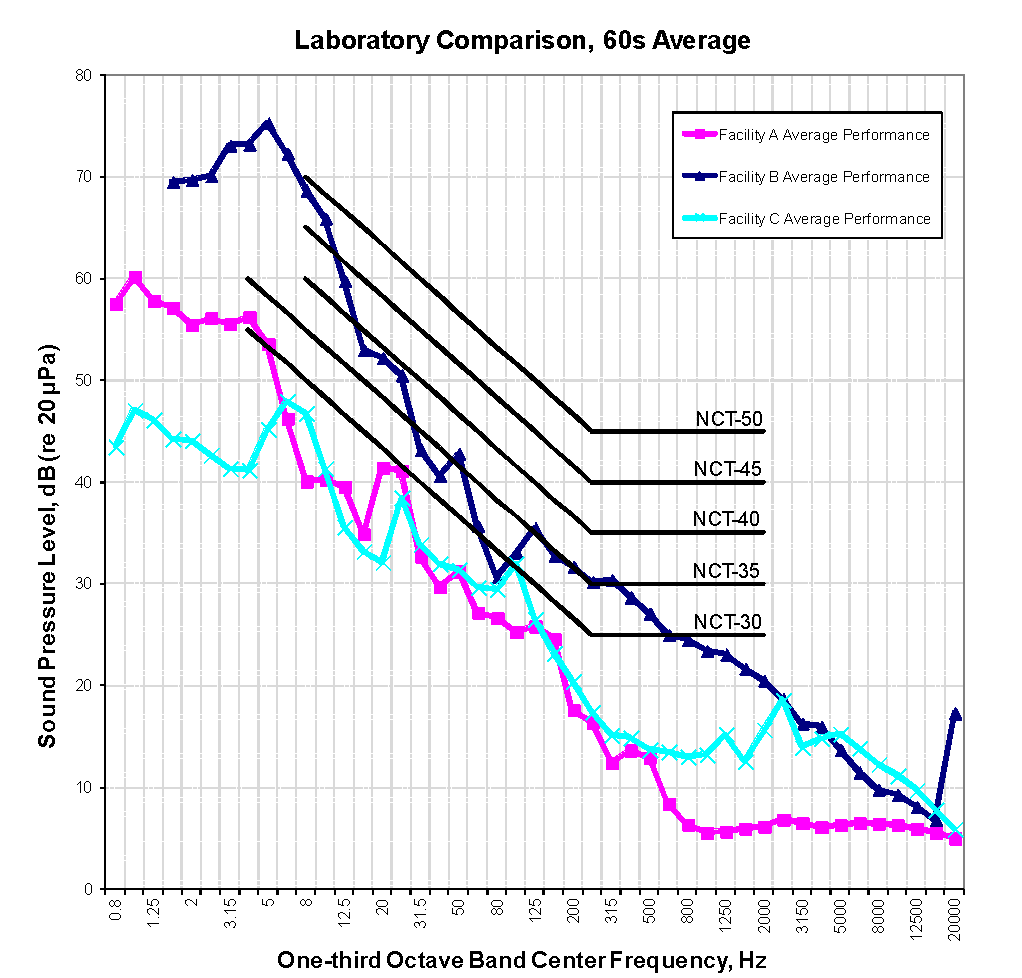
Fig. 8 – Background noise levels in Facility C TEM labs, compared to Facilities A and B
The background noise levels in the infrasonic range are exceptionally low in the Facility C labs, with noise levels up to 15 dB lower than those in Facility A and over 30 dB lower than in Facility B. These results show what can be accomplished if best practices in regards to infrasonic noise control are implemented.
4 DISCUSSION AND CONCLUSIONS
The case studies presented above illustrate not only the considerations and methodologies required to meet the low frequency noise requirements of many sensitive tools, but also what is potentially achievable using different design strategies and approaches to HVAC noise control within a space. The results from these and other studies point to multiple design strategies that should be followed when designing a laboratory with stringent infrasonic criteria:
- Forced air entering the space has the most significant impact on the infrasonic noise levels. The amount of forced air should be kept to a minimum, or eliminated, by the use of alternative heating and cooling methods such as radiant panels.
- The lab room volume should be as large as possible, and any ductwork entering the space should be as long as possible, in order to provide a space with a resonance frequency well below the most sensitive range of the instruments.
- Use of FCUs or other units located within the lab space are preferable to systems that introduce airflow from outside of the lab, if audio range noise is less of a concern than infrasonic noise.
- Surrounding walls, ceilings, and doors to the space should be relatively massive and rigid, in order to limit diaphragmatic excitation of these components by surrounding sources, which in turn excite infrasonic noise within the space.
Even with all of these considerations there is a practical lower limit, as a function of frequency, of noise levels that is both achievable and measurable using commercially available equipment. Beyond this limit (and, preferably, even approaching this limit), manufacturers will have to decrease their instruments’ sensitivity to acoustic noise by innovation and good engineering practice. However, even with new developments in instrument design, providing a laboratory environment that is as quiet as possible will remain important for cutting edge research, since new innovations and discoveries often involve pushing instruments beyond their rated capabilities.
5 REFERENCES
- M. Gendreau, “Specification of the effects of acoustic noise on optical tools,” Noise & Vibration Worldwide, Vol. 32, No. 4, April 2001, pp. 17-22
- M. Gendreau, “The Effect of Varying Acoustic Pressure on Vibration Isolation Platforms Supported on Air Springs,” Proceedings of the 16th International Congress on Sound and Vibration (ICSV16), Kraców, Poland (5 to 9 July 2009)
- M. Gendreau, “Generic Noise Criterion Curves for Sensitive Equipment,” Proceedings of Internoise 2012, New York, NY (19-22 August 2012)
- See ASHRAE 2007 Applications Handbook Chapter 47, “Sound and Vibration Control,” pp. 47.1-47.38 for a detailed description of this process.
- J. Lilly, “Suggested Modifications to ASTM Test Method E 477,” Sound & Vibration, June 2011, pp. 12-15
- e.g. ISO 7235:2003 Acoustics — Laboratory measurement procedures for ducted silencers and air-terminal units — Insertion loss, flow noise and total pressure loss, ISO 9614-3:2002 Acoustics – Determination of sound power levels of noise sources using sound intensity – Part 3: Precision method for measurement by scanning.
- The generic curves have been converted to one-third octave bands in this case, to match the format of the tool specification and measurement data. The values have been lowered by 5 dB to allow for summation to the appropriate octave band level, which is valid assuming relatively broadband acoustic noise levels.
- Figure extracted from M. Gendreau and B. Sennewald, “Infrasound in laboratories: criteria, phenomena, and design,” Meeting of the International Society for Optical Engineering (SPIE): Buildings for Nanoscale Research and Beyond, San Diego CA, USA (1 August 2005)
- M. Gendreau, “Measurement Techniques used to Verify the Cause and Nature of Low-frequency Noise in Rooms,” Proceedings of the 16th International Congress on Sound and Vibration (ICSV16), Kraców, Poland (5 to 9 July 2009)
- M. Hagerty, W. Kin, P. Martysevich, “Infrasound Detection of Large Mining Blasts in Kazakastan,” Monitoring the Comprehensive Nuclear-Test-Ban Treaty: Data Processing and Infrasound, Volume 159 (2002), No. 5, pp. 1063-1079