ABSTRACT
Bench-mounted optical microscopes have a wide variety of applications in science and technology. The vibration sensitivity is a function of magnification, vibration direction and support conditions. The paper presents the results of experimental studies addressing vibration sensitivity as well as the amplification and attenuation provided by typical laboratory casework. The benchtop vibration amplitudes at which the effects of motion first become perceptible were found for magnifications of 40x, 100x, 400x and 1000x using sinusoidal excitation. Frequency response functions were determined for benchtop motion with respect to floor motion, using both conventional casework and a representative pneumatic isolation bench. Floor vibration criteria were developed for microscopes with the two types of support.
INTRODUCTION
Benchtop optical microscopes are among the most common tools found in advanced technology and research facilities. They are used in medical laboratories, a wide variety of settings in research facilities, and semiconductor fabrication plants. The magnification employed depends upon the application, and typically falls between 40x and 1000x. (Occasionally microscopes are used at magnifications greater than 1000x.) Optical microscopes are usually not the most vibration-sensitive ones found in technology facilities, but they are perhaps the most widely distributed. When a typical advanced technology facility is designed, it is common to base the vibration criteria for the bulk of the building on the needs of the most commonly used equipment. Thus, most advanced technology buildings are designed for use of microscopes unless intended for equipment with more stringent requirements.
The vibration environments experienced by benchtop microscopes fall into two distinct categories; vibration induced by a person walking and that induced by the mechanical plant. The most common potentially disruptive vibration source is a person walking on the floor. In most laboratories, the predominant floor vibrations are vertical, though horizontal ambient vibrations may be present. On the other hand, most microscopes in semiconductor facilities are located in areas in which the predominant vibrations are horizontal, with vertical vibrations relegated to a somewhat secondary importance. Thus, a complete examination of microscope vibration sensitivity must address both vertical and horizontal components.
There is little in the literature regarding experimental determination of the vibration sensitivity of microscopes. The extant literature focuses on individual microscopes at specific magnifications1, 2; none of the extant literature has examined the variation of sensitivity with magnification. The design literature presents two sets of generic vibration criteria3, 4, both of which evolved from work by Ungar and Gordon4, in turn based on anecdotal experience and engineering judgment, but without experimental backup. Supplemental information was drawn from Reference 2. The prevailing design practice is based upon these documents, involving some assumptions regarding the type(s) of microscope(s) and magnification.6
An experimental program was carried out in which a representative benchtop optical microscope was tested using tonal excitation of a tabletop. The purpose was to obtain benchtop vibration amplitudes—as functions of magnification—that correspond to the threshold at which visible motion first becomes observable (for 40x, 100x and 400x magnification). This microscope was from the same manufacturer and family as that used by Amick and Bui2 which was tested at 1000x magnification, allowing combination of results from both studies, resulting in base criteria for that family at four magnifications. In addition, vertical amplification functions for built-in casework and a representative isolation bench were measured in-situ in a representative biotechnology research facility, such that vertical floor vibration criteria could be derived with and without supplemental vibration isolation. The horizontal amplification characteristics of the furniture used in semiconductor cleanrooms were not examined in this study.
Several disciplines, particularly those associated with biological research, require modification of conventional optical microscopes. These modifications may include imaging, manipulation of probes for studies of individual cells, and confocal technology. These modifications generally make the microscopes more susceptible to vibrations.
MICROSCOPE VIBRATION SENSITIVITY
The microscope used in this study was a new Nikon Eclipse Model E400 configured to provide magnifications of 40x, 100x and 400x. It is representative of binocular benchtop microscopes used in laboratories for a variety of functions. The earlier study by Amick and Bui2 used a similar microscope of an earlier generation, the Nikon Optiphot 66, configured at 1000x. The latter was common in semiconductor inspection applications.
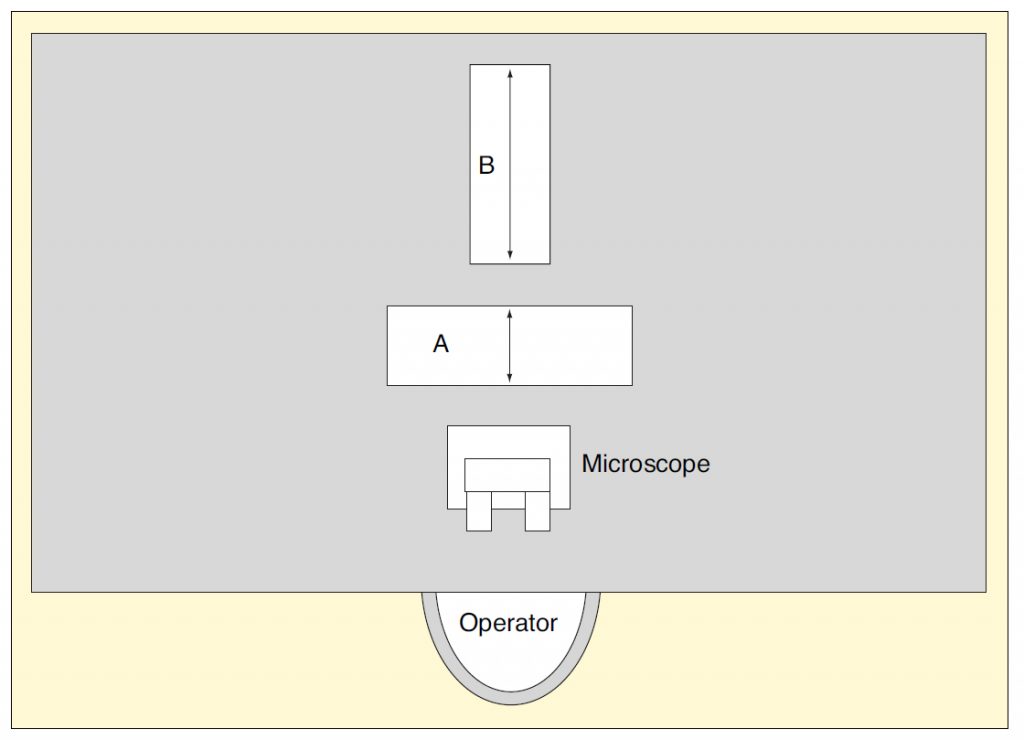
The test microscope and an electrodynamic shaker were placed on a long, relatively flexible table that was quite responsive to shaker excitation over most of the frequency range of interest (roughly 3 to 80 Hz). A calibrated accelerometer, charge amplifier and frequency analyzer were then used to measure the resultant velocity amplitudes at the base of the microscope. The test program was carried out in three configurations, one for each direction of sensitivity:
- Vertical – Microscope placed near the center of the table, with the shaker behind it, set up to apply a vertical force to the tabletop
- Fore-and-aft – Microscope placed at one end on centerline, shaker placed on the table behind it, with the resulting force axis passing through microscope
- Side-to-side – Microscope placed at middle of edge on long side, with the shaker behind it, both resting above the longitudinal axis of the table. In this case, both “fore-and-aft” and “side-to-side” refer to horizontal motion with respect to operator position.
Figure 1 illustrates the relative placement of microscope and shaker on the table with respect to the operator’s position. The shaker was placed in Position “A” to excite side-to-side motion and in position “B” to excite fore-and-aft motion. Vertical excitation was provided by placing the shaker at the center of the table, oriented such that the force was vertical.
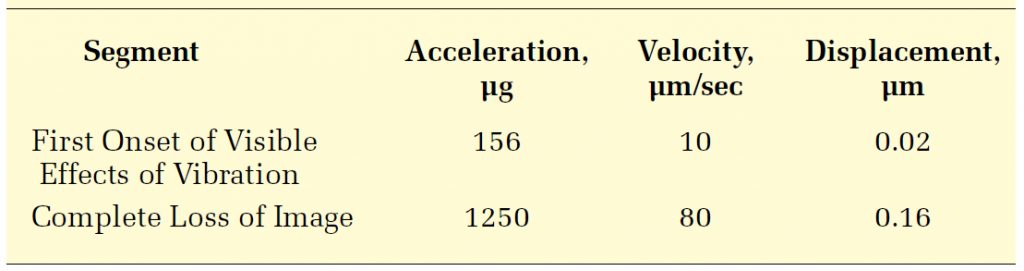
The objective of the study was to define the “threshold of perception” for the microscope as a function of magnification, rather than simply document the amplitude at which there was onset of interference with a particular task. The perception threshold was thought to be process-independent, allowing its application to a wider variety of research or inspection functions. To this end, a “neutral” object was used for observation—a graduated calibration standard, with etched lines of varying widths between 1 and 10 m.
The protocol used for both this study and the earlier one by Amick and Bui2 for determining the sensitivity at a particular orientation and magnification is similar to that described in Reference.7 It consisted of the following steps:
- Select a frequency
- Set the shaker at its lowest amplitude, and turn it on
- Increase amplitude while operator watches through eyepiece until motion first becomes visible (At frequencies less than about 22 Hz, the effect on the image was an observable jiggle; at higher frequencies, it was manifested simply as blurring.)
- Record the frequency and base amplitude.
- Change the frequency and repeat.
Once these steps were carried out for all the desired frequencies, the magnification was changed, and the process repeated.
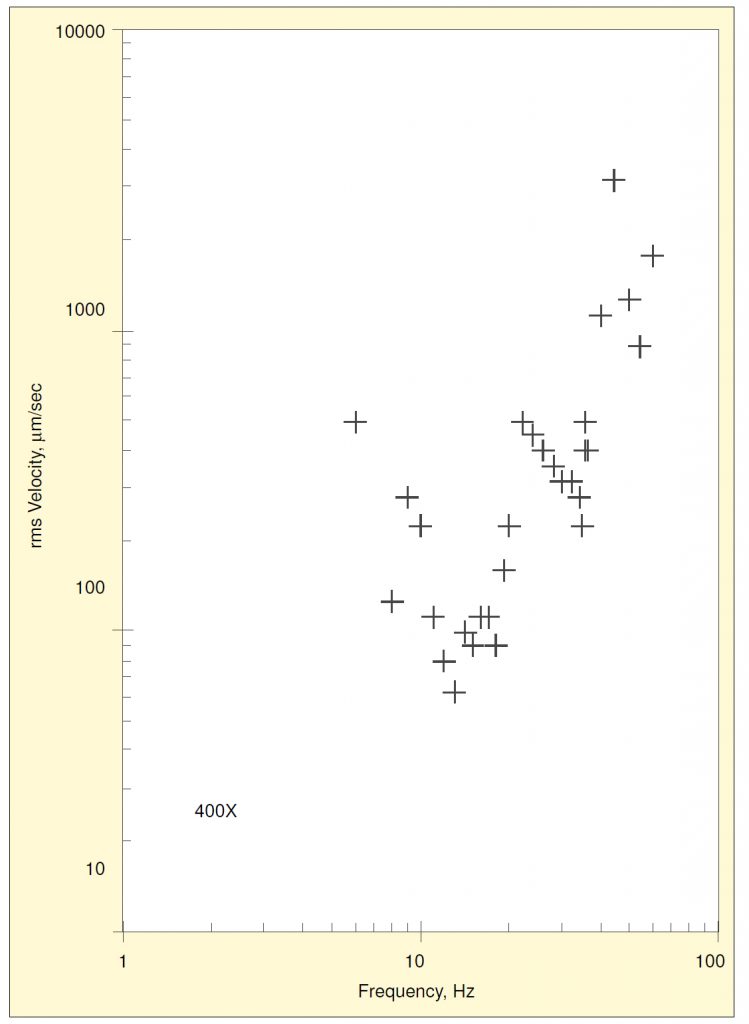
The threshold data were plotted as velocity amplitudes vs. frequency for each magnification and direction. For example, the data for vertical excitation at 400x are shown in Figure 1. The lowest value (i.e., the amplitude at the most vibration-sensitive frequency) occurred at a frequency near 13 Hz and corresponds to an internal resonance excited by vertical base motion. A second resonance occurred near 35 Hz.
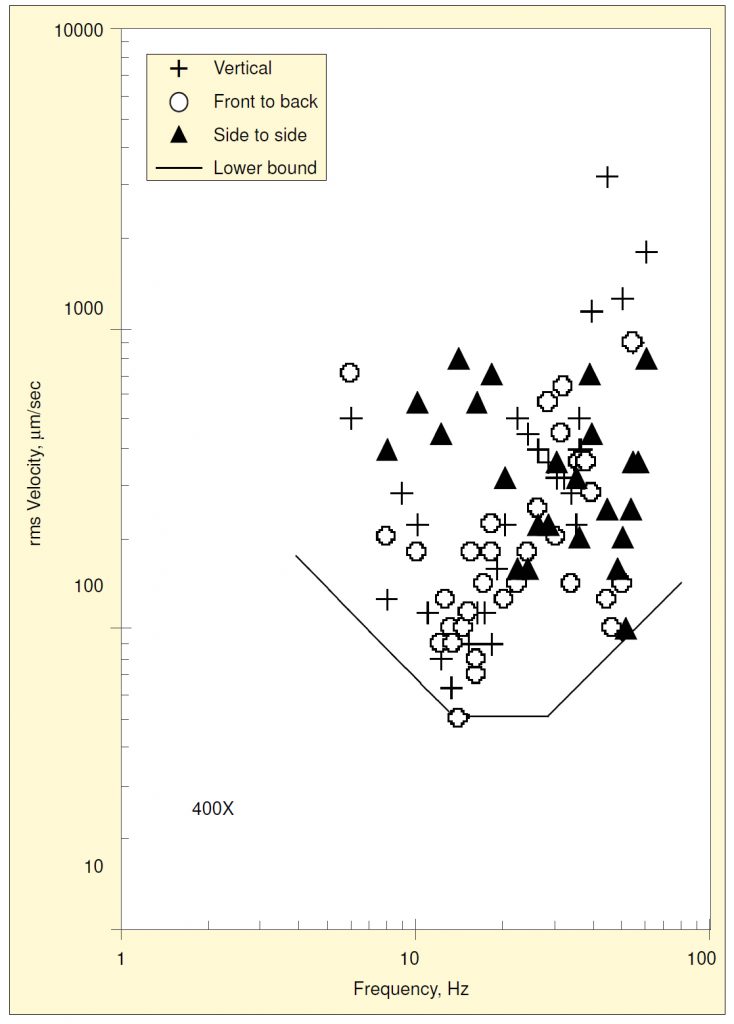
The data for all three directions of base motion are shown combined in Figure 2. The resonance near 13 Hz was also excited by fore-and-aft motion, but not by side-to-side motion. Motion in either horizontal direction excites a resonance near 50 Hz, which exhibits a much lower threshold amplitude than the vertical resonance at 35 Hz.
On a plot of log velocity vs. log frequency, a constant value of displacement is represented by a straight line sloping diagonally upward to the right at one decade per decade, and a constant value of acceleration is shown by a straight line sloping diagonally downward to the right. Shown in Figure 2 is a curve made up of three segments of straight lines defining the lower bounds of acceleration, velocity, and displacement for all three directional components together.
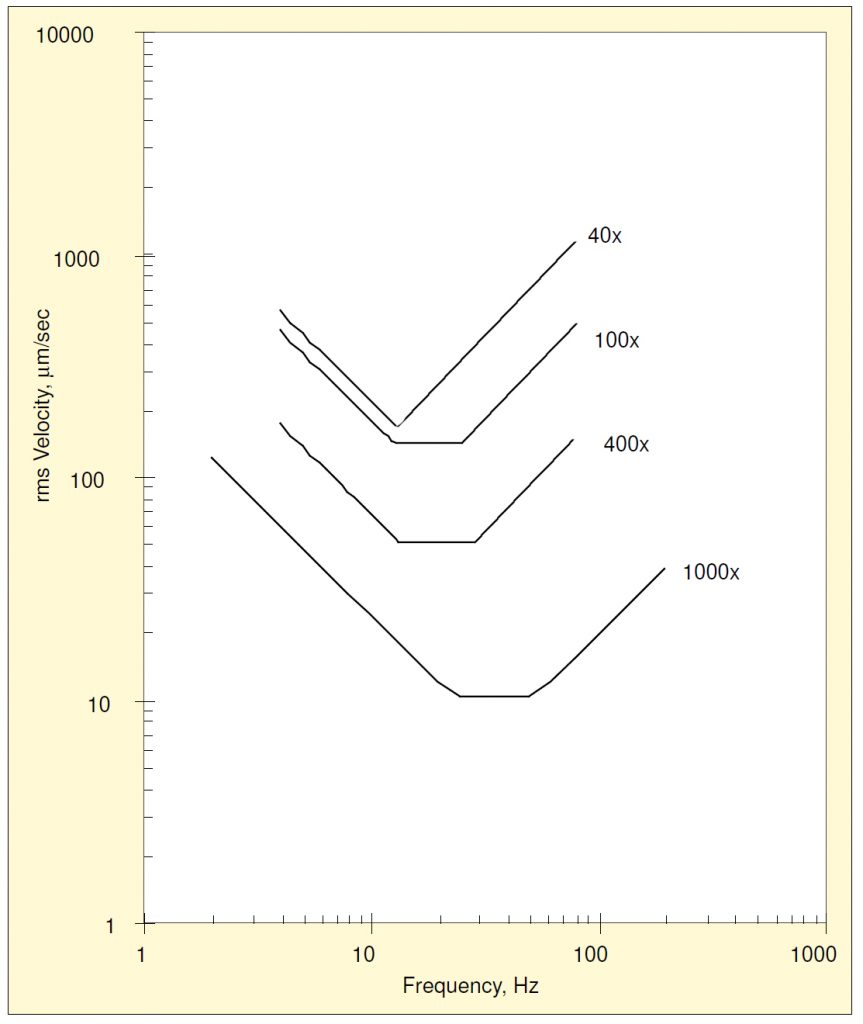
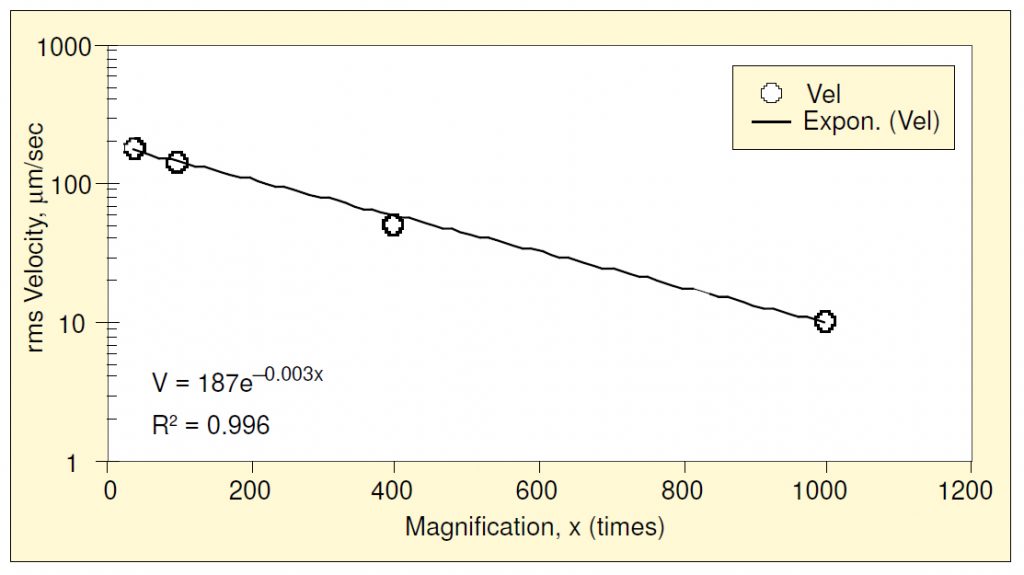
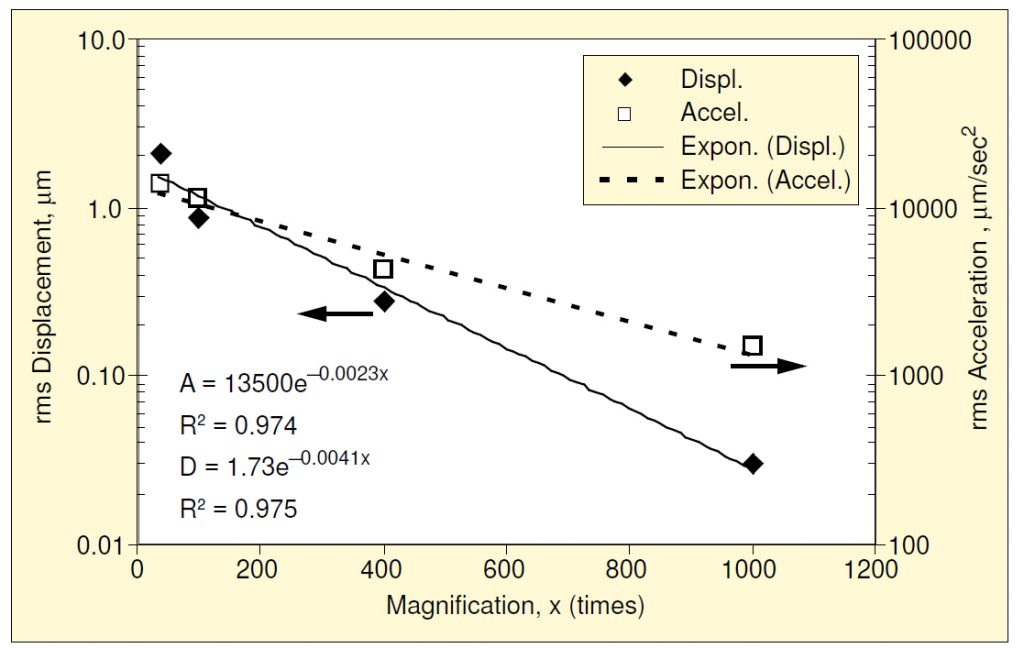
The same process may be repeated for the other magnifications studied, producing the family of lower-bound plots shown in Figure 3. Raw data from Reference 2 were used to construct the 1000x curve. Since the velocity lower-bound is constant with frequency, it can be treated as a single value as magnification is varied, as shown in Figure 4. An exponential function has been fit using least squares. Likewise, the displacement and acceleration lower bounds may be treated in a similar manner, as shown in Figure 5. Of the three, the displacement lower-bound varied the most rapidly with magnification (the rate of variation being the coefficient in the exponent); acceleration varied the least rapidly.
Amick8 used additional data obtained for the 1000x microscope to examine how perceptibility varied with amplitude and frequency. This involved a somewhat subjective process of increasing the amplitude at each frequency until the details of a 1 µm feature became indistinguishable. Figure 7 shows these data and a fit lower-bound, along with the fit of threshold of perception for comparison. The most sensitive direction with regard to image degradation is clearly side-to-side.
The two fit curves are defined in three segments in terms of constant acceleration (at low frequencies), velocity (at middle frequencies), and displacement (at higher frequencies). Table 1 summarizes the values associated with these segments of the threshold and degradation curves.
The “dynamic range” of image degradation may also be determined by dividing the degradation threshold amplitude by that of the perception threshold, and expressing this quantity as decibels, as defined in Equation (1). When this was done (for all three directions) the mean range was found to be about 20 dB, with a standard deviation of about 5 dB.
Dynamic Range

(1)
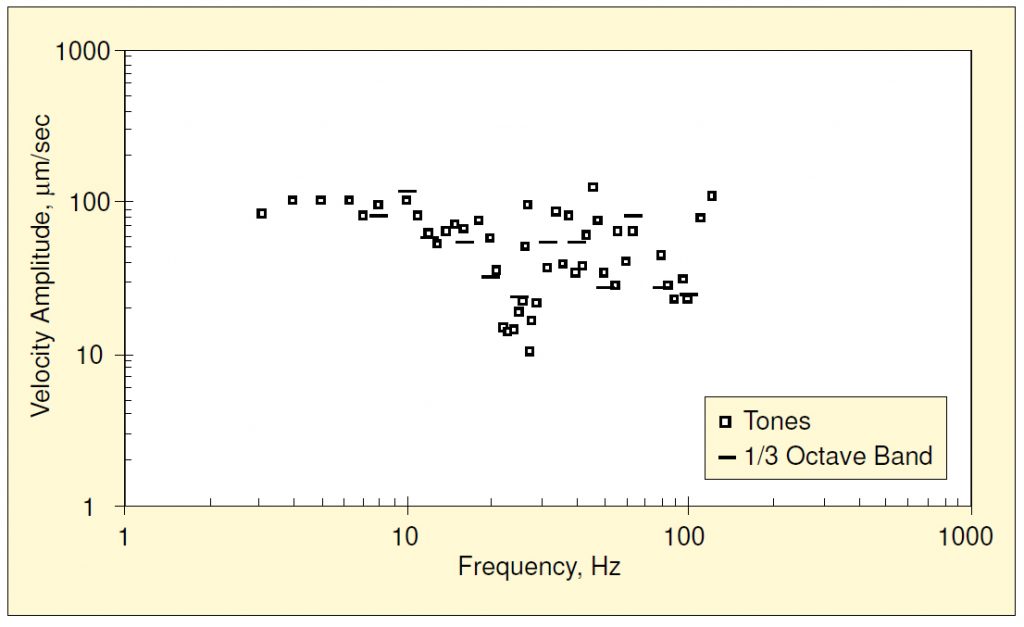
Amick and Bui2 also reported the results of a series of tests intended to demonstrate the relationship between tonal and broadband excitation. Measurements similar to those above were carried out (for 1000x magnification and side-to-side excitation) except that the forcing function was produced by a noise generator, the output of which was filtered through a tunable one-third octave bandpass filter prior to input to the shaker’s power amplifier. The one-third octave band filter was tuned stepwise to center on the standard center frequencies. Figure 6 compares the two thresholds. In both cases, the reported amplitude is the root-mean-square (rms) resulting from an energy average using a spectrum analyzer. The averaging times for single-frequency and broadband analysis were 30 s and 120 s, respectively.
It is evident that the thresholds are similar at frequencies distant from internal resonances, but near those resonances (20-30 Hz and 30-40 Hz) the broadband threshold amplitudes were consistently higher than those for tonal excitation. Amick and Bui2 speculated that this was because the resonance bandwidths associated with the resonances in these regions were so narrow (i.e., very low damping).
Another observation may be made regarding the similarity of the two thresholds at off-resonance frequencies. The amplitude of the force was increased until the operator first observed the effects of the vibration (e.g., jiggle or blurring). This occurred intermittently, coinciding with the occurrence of peaks in the time-domain signal. Thus, even though the instantaneous peak excitation appeared to control the onset of visible motion, there was agreement of rms amplitudes at off-resonance frequencies.
DYNAMIC ROLE OF A SUPPORT
Vibration criteria are generally discussed in terms of limits on floor vibrations. Up to this point, the microscope’s vibration sensitivity has been discussed in terms of its base motion. The induced motion characterized by Figure 2 through Figure 8 was that of a tabletop, and thus was somewhat independent of floor motion.
However, a microscope must be supported on some manner of bench, and the dynamic properties of that bench will tend to modify the floor vibration in some manner with a measurable frequency response function (or transfer function). The nature of that modification depends upon bench properties. Thus, the spectrum of the benchtop vibrations may be approximated by the product of the floor spectrum and a frequency response function (FRF) representing the effects of the bench.
In any building, floor motion consists of a mix of vibrations from a number of sources:
- outside the building, such as those from traffic or rail vehicles,
- inside the building, from mechanical and process support equipment, and
- inside the building, from personnel activities such as people walking.
In most cases, the predominant vibrations are those of the last group, but the nature of the walker-generated vibrations depends upon the nature of the floor itself. The presence or absence of a raised access floor determines whether walker-generated vibrations are predominantly horizontal or vertical. A raised access floor – sometimes called a “computer floor” – consists of 24 x 24-inch tiles (usually metal) that rest on a set of pedestals. The pedestals generally consist of a cast aluminum block, typically supported on aluminum tubes. (See http://www.tateaccessfloors.com/understructure_aluminum_systems.html). They tend to be about as stiff in the vertical direction as the floor on which they are supported but are relatively very flexible in the horizontal direction. A person walking on an access floor will generate vibrations with amplitudes much higher in the horizontal directions.
In this section, we will focus on settings without access floors, thus somewhat limiting the remaining discussion to laboratories, in which the predominant walker-generated are vertical. The corresponding discussion for cleanroom applications requires consideration of horizontal vibrations.
A variety of support conditions are possible in a generic laboratory, ranging from “rigid” to “soft”. The two extremes might be approximated by built-in lab benches (at the more “rigid” end of the continuum) and special-purpose pneumatic vibration isolation benches (at the “softer” end of that continuum). These two conditions were evaluated in an upper-floor lab of a newly-constructed biotechnology lab. A Newport model LW 30” x 36” workstation [http://newport.com/LW-Series-Light-Load-Vibration-Isolation-Workstati/139804/1033/catalog.aspx] was selected as a representative vibration isolation bench. The Dow Diversified lab casework used in this facility was wood with a heavy steel frame and was floor-mounted [http://www.dowdiversified.com/projects-edu-ucsfgenentech03.html].
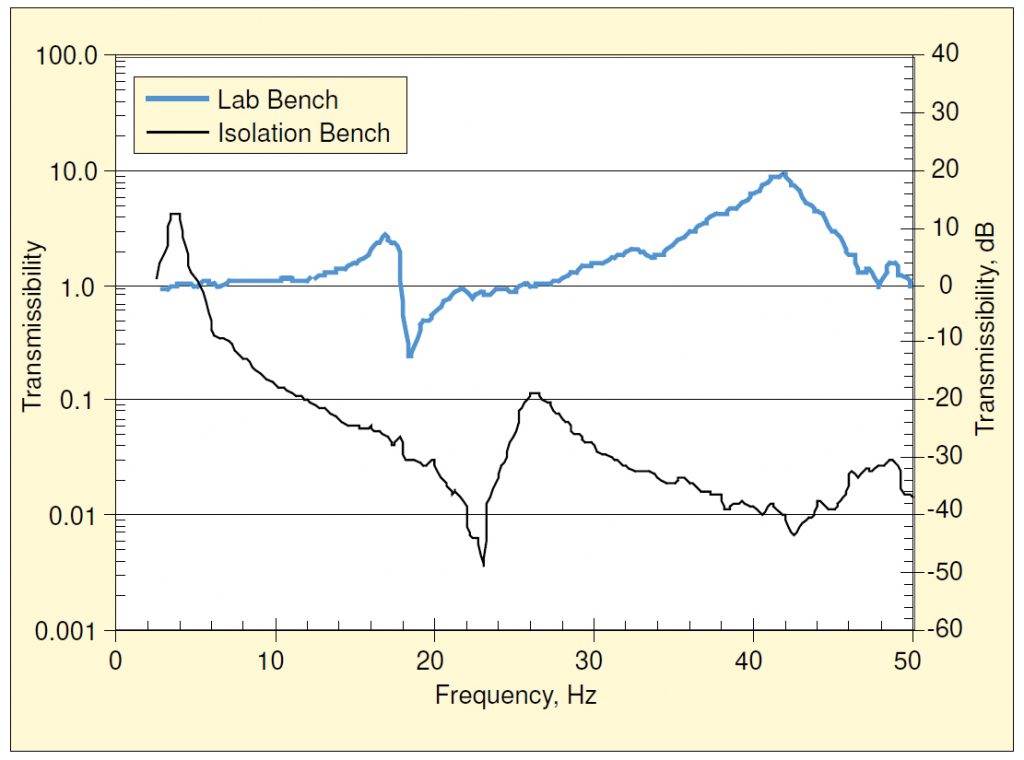
A two-channel spectrum analyzer was used to measure FRFs showing amplification of vertical vibrations by these two support conditions. These are shown in Figure 9. The floor vibrations during the FRF measurements included a combination of ambient (mechanical) vibrations, footfall, and heel drop. At the time of the testing, the bench top supported a dummy load similar to that of a microscope, but the microscope itself was not present.
The built-in lab bench exhibited a vertical resonance at 17.5 Hz with an amplification of about 7 dB, and another at around 42 Hz which amplified by about 19 dB. Between 0 and 50 Hz, the only attenuation was that associated with the anti-resonance near 19 Hz. On the other hand, the isolation base exhibited a resonance at 4 Hz, where there was an amplification of 12 dB, and attenuation at all frequencies above 5 Hz.
The dynamic characteristics of casework will vary from one fixture to the next, but the basic behavior is representative. In particular, the frequency of the fundamental resonance (17.5 Hz, in this case) and the amount of amplification (i.e., 7 dB) will vary. The extent to which the footfall-generated vibration will pose a problem will thus involve some interaction between the walker rate, the floor resonance, the fixture resonance, and the microscope’s internal resonance. With the isolation base, the setting is somewhat simpler, since isolation benches tend to behave as single-degree-of-freedom oscillators with resonances between 2 and 4 Hz associated with the pneumatic isolators. Internally, they are somewhat rigid, so the internal resonances are at high frequencies, and somewhat independent of walker rates and microscope resonances.
In Figure 4 we note that the microscope was most sensitive (in terms of velocity) at frequencies between 13 and 50 Hz, depending upon magnification. Figure 9 shows us that the lab bench offered virtually no attenuation in this frequency range and amplified at some frequencies. On the other hand, the attenuation provided by the isolation bench was at least an order of magnitude (i.e., >20 dB) over this entire range.
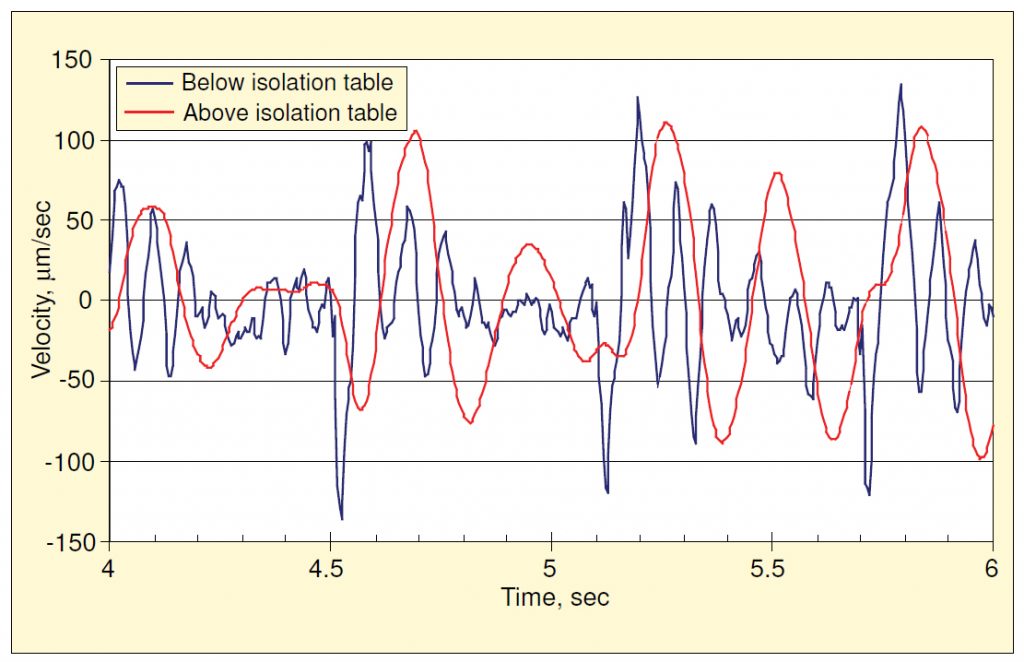
Except for the amplification around the two resonances, the vibrations atop the built-in bench were quite similar to those of the floor. Figure 9 shows two velocity time histories—one measured on the floor during footfall and the other at the same time atop the isolation bench—illustrating the change provided by the isolation bench. The maximum instantaneous velocity was about the same at both locations, but the frequency content changed dramatically. The floor vibration was predominantly at the floor’s resonance frequency (about 7.25 Hz), plus some higher-frequency content, generally at multiples of the walker impact frequency. The vibration atop the bench was almost entirely at the resonance frequency of the pneumatic spring (4 Hz), well below the sensitive range of the microscope being studied.
MODIFICATIONS TO GENERIC MICROSCOPES
Thus far, the discussion has focused on what might be called ‘generic’ microscopes – ones that are used simply for visual observation and without significant modification. Inverted microscopes, which view specimens from below and not above, have vibration sensitivity similar to those described previously. However, many of the other modifications to conventional microscopes, such as those required for many biological applications, will alter the vibration sensitivity of the system.
Several optical microscope-based systems are significantly more vibration-sensitive than the microscopes themselves and approach vibration sensitivity on the order of that of electron microscopy. Typically, electron microscopes work in a range of 100 to 1000 times the magnification, and are generally assumed to have sensitivity on the order of between 3 and 6 μm/sec. In general, these changes in sensitivity are associated with the process being carried out rather than the specific microscope and its magnification.
The adaptations fall into two major categories: those involving manipulation and those involving imaging of some sort. The vibration criteria that follow are based on careful examination of anecdotal evidence compiled by biologists, rather than on an experimental study as presented previously. To date, little or no experimentally based criteria are available.
One family of adaptations involves using devices intended to facilitate contact with individual cells, either for material transfer into or out of a cell (generically called microinjection) or for electrical communication with the cell (in which case the process is usually referred to as electrophysiology). Vibrations can excite resonances in the manipulator system or the probe (or both) so that any of several problems may arise.
In most cases involving vibrations at frequencies less than about 20 Hz, the vibration manifests as motion (jiggle) of the probe and the cell. This motion can be synchronized (probe and cell moving together in unison) or unsynchronized (probe and cell have differential motion). There are often operational problems with either type of motion; the operator has difficulties coordinating the ‘steering’ of the probe with the visible movement of the image. This increases the risk of error in placing the probe. In many cases, however, there is differential motion between the probe and the cell, which may damage the cell or degrade the experimental results.
If the attachment of the probe to the cell is successfully carried out, the differential motion eventually degrades the bond between the cell and probe. This can lead to premature cell death. Some experiments require as much as two hours, but if detachment or cell death occurs prematurely (say half an hour), then the value of the experiment is diminished or eliminated. In some settings, the degradation causes leakage, contaminating the interior of the cell being manipulated.
The vibration sensitivity of a system with manipulation apparatus is usually associated with resonances of the manipulation system or the probe itself. It has been observed at very low frequencies, on the order of 1-5 Hz. Therefore, this kind of system violates the generalization that microscopes become less sensitive at low frequencies.
A large fraction of microscope use is to capture images from which experimental data are derived via image processing. This may consist of a variety of methods, some of which are listed below.
- Relatively simple photographs at high resolution which are subsequently processed by image-analysis software to produce numerical representation of certain visual aspects. As with conventional photography, jiggle can result in blurring of the image. If the software requires a high degree of clarity, the numerical results may be faulty. For example, there are processes examining features that have one pixel of resolution. If the motion is of the same order of magnitude, the image processing software may misinterpret the position and yield incorrect data. In other related applications, the image processing is indeed for image intensification, in which longer exposure times become important.
- Time-lapse photography, where sequential photographs are assembled to document a process that occurs over time. Vibration has been observed to cause the cell to migrate in the visual field. Vibration-induced migration by itself may be a ‘contaminant’ of the process, especially if the point of the study is to examine migration as the result of some stimulus.
- Many biological experiments involve the superposition of photographs taken at different times using different stimuli or light sources, analogous to the semiconductor photolithographic process. The experiment may require reproducible alignment and image overlays, sometimes involving deceptively small magnification. Migration in this context is a significant experimental problem.
- Fluorescence studies involve the use of a stimulus to cause a cell (or a portion of that cell) to glow or fluoresce. Generally, these studies occur over a period of time and may involve multiple exposures that must subsequently be aligned. The process itself may relate to one of the previous ones, but the experiments are often just denoted ‘fluorescence.’
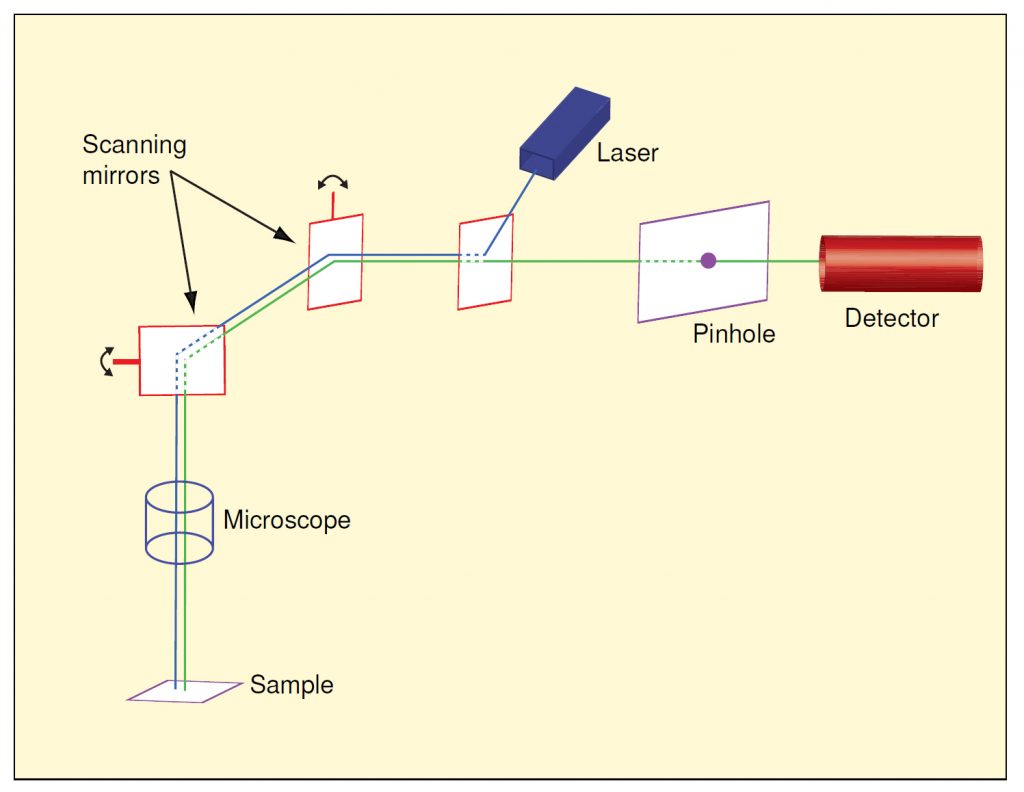
The third major category of microscope modification involves confocal microscopy. This is a fairly complex mechanical process and exploits some optical ‘tricks’ to provide very precise imaging. The process defines a plane (or slice) within the specimen with an extremely small depth of field. Points above or below that plane—which conventional optics would simply render as “out of focus”—simply are eliminated.
Reference 9 presents a very lucid explanation of confocal microscopy and is summarized at http://www.physics.emory.edu/~weeks/confocal/. Figure 119 shows conceptually how the process works. The microscope portion is subject to the same vibration constraints as a conventional microscope, but the scanning mirrors and their support system introduce their own resonances and tracking errors. The need for stable alignment between the detector, pinhole, laser and mirrors adds further vibration sensitivity to the instrument as a whole.
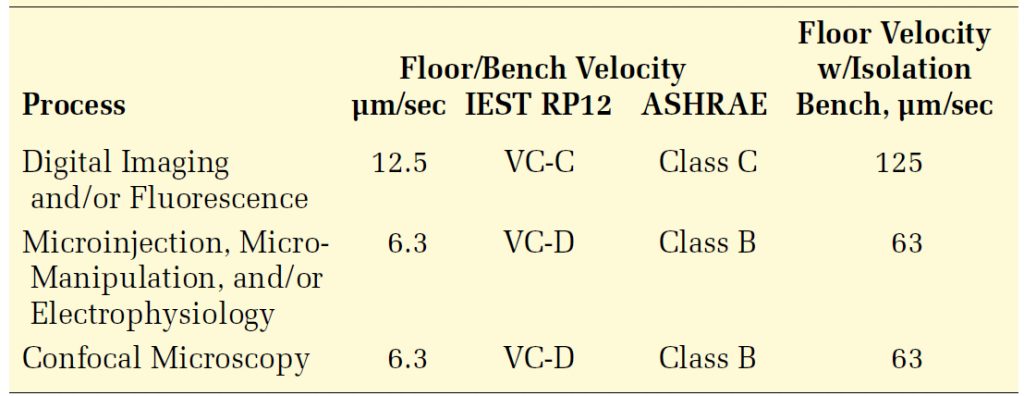
Table 3 summarizes the criteria believed to be appropriate for several types of modified optical microscopes. They are far more subjective than those given for unmodified microscopes, and for the most part are not based on experimental procedures designed specifically to assess vibration sensitivity. Rather, the criteria evolved from comparing environments in which these processes were carried out and there was the perception by researchers that vibration effects could be judged qualitatively. Some of these environments were assessed as adequate, others were inadequate, and some were marginal. In some cases, it was possible to infer frequency sensitivity based on observation of motion over the course of the experiment. These criteria supersede any that are based on magnification, such as those presented in Table 2.
The anecdotal information is somewhat limited for confocal microscopy. Confocal microscopes are generally known to work quite well in on-grade locations (such as basements), and with limited success on suspended floors. Some researchers believe they were approaching the limits of the technology in a space that was found to have vibrations on the order of 15 μm/sec in both vertical and horizontal directions. (Most of these systems were thought to be on vibration isolation systems at the time.) None of these reports give any indication of the frequency at which these systems are most susceptible. So, we have concluded that a criterion of 6.3 or 12.5 μm/s is appropriate. The 6.3 μin/sec criterion is listed in Table 3; this presumes that the technology may evolve to be more sensitive to vibration as the feature sizes of interest become smaller.
It is somewhat customary, especially with the processes characterized by VC-D, to place the experimental apparatus on optical benches supported by pneumatic springs. In general, this is useful but can pose a challenge in some instances. Some systems in the second group in Table 3 appear to have internal resonance frequencies between 1 and 5 Hz, the range in which typically lie the resonance frequencies of the air spring isolation system. Amplification of both horizontal and vertical motion can occur. If severe enough, it will appear as a nearly steady-state jiggle at the airspring frequency. If these systems are placed in on-grade spaces, it is unlikely that the horizontal vibration will pose a problem. However, in a multistory lab, it is possible that the building’s fundamental horizontal resonance frequency will fall in this same range. If attempting to diagnose a low-frequency problem with one of these systems, the investigator is advised to check the severity of the horizontal motion at frequencies less than 5 Hz.
One of the few options for mitigating excessive low-frequency vibration is an isolation system employing active or active/passive technology. However, these systems generally have a minimum vertical stiffness requirement for the floor, so the solution is not universally applicable.
Critical Self-Examination
The observations reported here merged the results of two experiments. 2,10 The original study at 1000x was intended to address applications in the semiconductor industry. The subsequent study at 40x, 100x, and 400x was intended to address questions that arose after the first study and was intended to address biological applications, rather than those in the semiconductor world. Initially, they were seen as two independent exercises, and the decision to merge them was something as an afterthought. In addition, the second study was somewhat limited in scope because of the authors’ limited experience with biological research.
The opportunity to have some close interaction with several biological researchers allowed a thorough review of the two studies with regard to each other as well as to their applicability to biological research. A number of key issues have been identified and should be addressed if there is an opportunity to carry out a similar study with more extensive scope.
The microscopes and the observer.
Each of the two studies represents a single set of observations by a single individual on a single microscope. (The same observer was used for both studies, but a number of years had passed.) The following questions remain unanswered:
- What was the variability of the single individual (from one session to another, or from one day to another)?
- What was the variability between the two microscopes? The earlier one was manufactured about a decade earlier, and though thought by the manufacturer to be similar, they were not identical.
- How valid was the combination of the data?
- What would be the variability from one individual to another?
- What would be the variability from one microscope to another of the same manufacturer and model? From one model to another? From one manufacturer to another? (Researchers have reported variation between microscopes of the same model number because of slight variations in internal parts.) How correct is the assumption that an identical optical path leads to identical vibration susceptibility?
Definition of “Threshold of Perception.”
The two studies involve a threshold based on the amplitude at which blur (or motion) becomes apparent to an observer, based in part on the arc-second resolution of the human eye. This definition has impacted the study in two ways:
- The eye offers certain preprocessing capabilities mostly at a subconscious level. The eye tries to fill in gaps in images and stabilize images where there is slight movement. In other cases, the eye interprets things that aren’t even there, as exploited by the artist M.C. Escher. One might expect different thresholds to be identified depending on whether the “blur point” was approached from a lower amplitude or a higher one.
- A growing fraction of microscopy involves perception that has little or no involvement of the eye. The influence of machine vision in industrial environments has fueled a trend toward quantification of imaged objects using capture devices such as CCD.
When using these technologies, the eye’s preprocessing capacity is completely absent during an experiment, yielding an entirely different criterion. Most likely, it will be more stringent.
Nature of Target.
The image being viewed in both studies was an etched calibration slide with a line 1 μm wide (though a wider line was used for the 40x and 100x portions). With regard to human vision, this introduces two problems:
- Blur in the horizontal plane is probably more apparent to the human eye than blur along a vertical axis (along the light path). In the horizontal plane, motion is most likely perceived as motion; in the vertical plane, it may not even be perceived as moving, just shifting very slightly in focus (depending on the depth of field).
- The eye and brain have different interpretations for motion of a line (or edge) depending on whether the motion is in a direction along that line or is transverse to that line.
These two factors suggest that nanospheres might be a more appropriate viewing target for future studies.
Cell Motion in Medium.
In biological studies, specimens are often floating in an aqueous medium. Movement of the microscope body (or at least the stage) can result in a form of wave generation that may cause the cell to move in the field. This could lead to a number of problems, including misinterpretation by machine vision. However, if the study itself involves cell migration, then this oscillatory cell motion represents experimental ‘noise.’ The phenomenon would be challenging to quantify but should be examined.
Learning by Observing.
Dr. Harold Spurgeon of NIH suggests revisiting the data in Figure 2 as a function of the trial number. If there is a learning component to the data, there may be some order to the data at a given frequency. For example, he observed that solid triangles at frequencies near 40 Hz vary by an order of magnitude. He raised the question of whether the observer might have been able to preprocess the image successfully at 1000 μm/sec after some trials and raise the ‘apparent’ threshold at this frequency. There are documented parallels in auditory perception, and any subsequent study should address this issue.
Conclusions
A program was carried out to determine the sensitivity to tonal vibrations (in all three directions, excited separately) of a binocular bench microscope. The sensitivity was addressed in terms of both frequency and microscope magnification and extended the work of a previous study.2 One purpose of the study was to validate published vibration criteria that had initially been based on anecdotal information and engineering judgment.
The sensitivity was found to be greatest at resonances with frequencies between 10 and 50 Hz, and the limit could be expressed as a curve representing lower bounds on acceleration, velocity, and displacement. All three forms varied exponentially with magnification. The general forms of the bounds and the relationships between them should be applicable to other microscopes of this type, but there may be slight variation in resonance frequencies and/or threshold amplitudes from one brand to another owing to differences in internal construction of the microscopes. A pneumatic optical bench will reduce the vibration sensitivity by approximately one order of magnitude, allowing significant magnifications in relatively poor vibration environments. (The actual attenuation will depend on the frequency of the vibrations being attenuated.) The instantaneous velocity for a person walking may not change appreciably with application of passive pneumatic isolation, but the predominant frequency of walker-induced vibration is shifted downward to the natural frequency of the vibration isolation table and into a range where the microscope is much less sensitive.
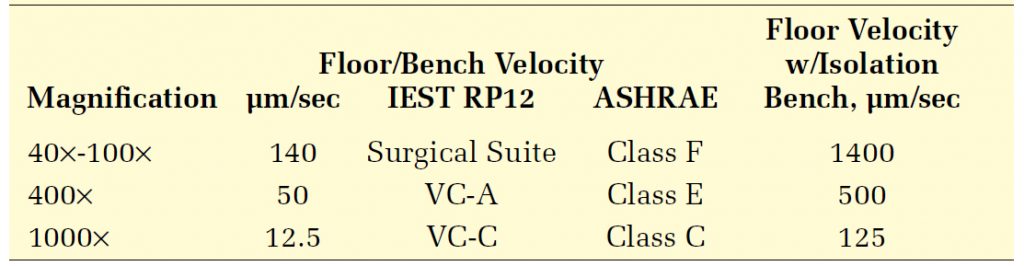
The study confirmed that a microscope’s vibration sensitivity varied with magnification. Table 2 summarizes the limits developed from these experiments and compares them with two popular families of generic criteria. The floor criteria (assuming the use of an isolation bench) are also given. The results support the use of IEST and ASHRAE generic criteria, which set 100 μm/s as a limit for a generic laboratory intended for the use of 40x and 100x microscopes, 50 μm/sec for laboratories in which 400x microscopes are to be used, and 12.5 μm/sec for 1000x microscopes.
These criteria apply at the floor and account for the vertical effects of conventional laboratory bench work. Note that conventional casework can amplify vibrations in the frequency range where the generic microscope is sensitive, so the setting is somewhat complex. But they do not account for the horizontal dynamic characteristics of the bench work used in semiconductor clean rooms, so they may not be directly applicable to horizontal vibrations of a clean room’s raised access floor.
‘Conventional’ optical microscopy might be defined as that involving generic optical microscopes of the sort addressed experimentally and presented here. A significant body of anecdotal information from the biological research community suggests that several modifications to conventional optical microscopy can dramatically increase the vibration sensitivity from that associated with the microscope alone and the magnification at which it is used. At this time, there is no quantitative information regarding sensitivity of such modified microscopes, so experimental studies analogous to those reported here are recommended to determine sensitivity in terms of both amplitude and frequency content and with regard to vibrations in all three directions.
The results of this study suggest that where isolation benches are used, higher floor vibration amplitudes may be acceptable. This may lead to reduced structural stiffness and resulting lower structural cost. But this issue should not be oversimplified. Excessive horizontal vibrations at the resonance frequency of a pneumatic system may require active or active/passive vibration isolation for mitigation, and those systems may not perform adequately if the floor stiffness is reduced.
Further studies are recommended to document the dynamic characteristics and amplification, or attenuation characteristics of clean room bench work used for microscope support. It may also be advisable to verify that the results presented here are applicable to other brands of microscopes. Another major category of microscope – that used for surgery – is not represented by this study; they have many different support structures that will affect their susceptibility to vibration.1
Acknowledgements
The authors gratefully acknowledge the microscope provided by Nikon and the isolation bench provided by Newport Corporation.
We also appreciate the valuable contribution by several medical researchers to our understanding of the detailed biological applications of microscopy. These scientists include Dr. Will Grimes, Dr. George Mentis, Dr. Steve Sollott, Dr. Harold Spurgeon, and Dr. Kenneth Fishbein, all of the National Institutes of Health; Dr. Eric Westin of Eli Lilly; and Prof. Eric Weeks of Emory University. The criteria for biological applications simply would not exist without their translation, input and discussions. In particular, we are indebted to Drs. Fishbein and Spurgeon for their very detailed critique of the study with regard to digital imaging and three-dimensional aspects of microscopy, as well as the issues associated with probe-cell attachment and detachment.
References
- House, M. H., and Randell, R., “Some Measurements of Acceptable Levels of Vibration in Scientific, Medical and Ophthalmic Microscopes,” Proceedings of International Society for Optical Engineering (SPIE), Vol. 732, pp. 74-80, 1987.
- Amick, H., and Bui, S. K., “A Review of Several Methods for Processing Vibration Data,” Proceedings of International Society for Optical Engineering (SPIE), Vol. 1619, pp. 253-264, Society of Photo-Optical Instrument Engineers, San Jose, CA, 1991.
- Institute of Environmental Sciences and Technology, “Considerations in Clean Room Design,” IES-RP-CC012.1, 1993.
- ASHRAE Handbook: Applications, Chapter 47, “Sound and Vibration Control,” American Society of Heating, Refrigerating and Air-Conditioning Engineers, 50 pp, 2003.
- Ungar, E. E., and Gordon, C. G., “Vibration Challenges in Microelectronics Manufacturing,” Shock and Vibration Bulletin, Vol. 53(I), pp. 51-58, May 1983.
- Amick, H., Gendreau, M., Busch, T., and Gordon, C., “Evolving criteria for research facilities: vibration,” Proceedings of SPIE Conference 5933: Buildings for Nanoscale Research and Beyond, San Diego, CA, July 31, 2005 to August 1, 2005
- Gordon, C. G., and Dresner, T. L., “Methods of Developing Vibration and Acoustic Noise Specifications for Microelectronics Process Tools,” Proceedings of International Society for Optical Engineering (SPIE), Vol. 2264, July 1994.
- Amick, H., “On Generic Vibration Criteria for Advanced Technology Facilities: with a Tutorial on Vibration Data Representation,” Journal of the Institute of Env. Sciences, pp. 35-44, Sept/Oct. 1997.
- Semwogerere, D., and Weeks, E. AR., “Confocal Microscopy,” Encyclopedia of Biomaterials and Biomedical Engineering, Taylor & Francis, 2005.
- Amick, H., and Stead, M., “Vibration Sensitivity of a Laboratory Bench Microscope,” Paper presented at the First Pan-American/Iberian Meeting on Acoustics; 144th Meeting of the Acoustical Society of America, Cancun, Mexico, December 2-6, 2002.
- Murray, T. M., David E. A., and Ungar, E. E., “Floor Vibrations Due to Human Activity,” Steel Design Guide Series 11, American Institute of Steel Construction (AISC DG-11), 69 pp, 1997.
Footnotes
-
* Portions of this paper presented at the First Pan-American/Iberian Meeting on Acoustics; 144th Meeting of the Acoustical Society of America, 2-6 December 2002, Cancun, Mexico ↑
H. Amick, “Visually Observable Vibration Sensitivity of a Laboratory Bench Microscope,” presented at InterMicro 2007, July 9-13, 2007, Chicago, IL.
159519b1f09d3a843c6e9ba0106c677f