Introduction
A concrete slab-on-ground is one of the most common of all floor types. Slabs-on-ground are popular for many applications, especially in research facilities, where they usually provide the highest-quality vibration environment. This is because they are stiff and uniformly supported, such that they do not exhibit the resonance characteristics of a suspended slab. As a result, they are much less responsive to footfall.
Occasionally, the value of a slab-on-ground is degraded because the slab is separated from the subgrade soil, leaving a void. If this void is of large area (in plan), the floor will behave more like a suspended floor, exhibiting resonances and becoming more responsive to footfall and mechanical excitation. In a laboratory space, this could render the floor useless. In some settings, separation from the soil might weaken the floor construction and lead to cracking of the slab.
A void can form for a number of reasons, including curling or subgrade settlement. Settlement may be due to non-uniform compaction and can easily occur in the backfill to retaining walls, particularly if there is wall movement. Settlement can also occur when water flows horizontally beneath the slab, washing away the subgrade.
Regardless of the cause, it is often desirable to detect the presence of a void or determine its horizontal extent, as well as verify that corrective measures have been successful. This article presents the results of one such remedial study, with measurements before and after remediation by grout injection.
Dynamic Characteristics of a Slab-on-Ground
A slab-on-ground may be considered as a plate on an elastic foundation, assuming that the soil is indeed elastic. When a vertical point load is applied on a slab, the slab will deform downward in a dish shape with the maximum deflection occurring beneath the load. The local reaction pressure of the soil against the underside of the slab will be a function of the deflection in that vicinity. It has been shown1 that the reaction pressure p of an elastic foundation beneath a plate may be given as:

(1)
where S is the modulus of subgrade reaction of the soil beneath the slab, with units FL-3, and w is the local displacement downward. D is the plate rigidity, defined by

(2)
where t is slab thickness and E and ν are the Young’s modulus of elasticity and Poisson’s ratio of the concrete, respectively. The term l in Eq. (1) represents the characteristic length, which is defined as

(3)
These relationships may be arranged to define a point stiffness in terms of the slab thickness and elastic properties of the concrete along with the subgrade modulus,

(4)
The subscript s on the stiffness indicates that it is a static stiffness. As with a single degree of freedom system, the point resistance of a slab on grade varies with the frequency of the applied load, defining the notion of dynamic stiffness, or stiffness that varies with frequency. Generally, dynamic stiffness is identical to static stiffness at low frequencies, i.e., frequencies significantly less than the fundamental resonance frequency of the slab-foundation system.
We have observed that a slab that is in solid, uniform contact with the subgrade does not usually exhibit resonance at frequencies less than about 80 Hz, and the stiffness is relatively constant with frequency. On the other hand, the presence of a void of significant horizontal dimension will result in resonance in this frequency range which is observable in certain types of dynamic measurements.
In the sections that follow, we will illustrate the dynamic characteristics of both a well-founded slab and a slab with a void at the slab-ground interface. We discuss how that void was remediated. Follow-up measurements demonstrated that the remediation was successful, eliminating the resonance and producing behavior similar to the well-founded portion of the slab.
Measuring in-situ slab properties
The impulse-response test 2,3 permits measurement of frequency-dependent response to an impact load. Test results are presented in a manner representing the dynamic response (motion amplitude per unit force) or the dynamic resistance (force amplitude required to cause a unit amplitude of motion).
Response to the impact load may be represented in terms of displacement (d), velocity (v), or acceleration (a) spectra, each divided by the excitation force spectrum (F), in which case the resulting normalized spectra are known as receptance (or compliance), mobility or accelerance, respectively. The inverse of receptance is dynamic stiffness. [For greater detail on the representation of impulse-response data, see Ref. 2.]
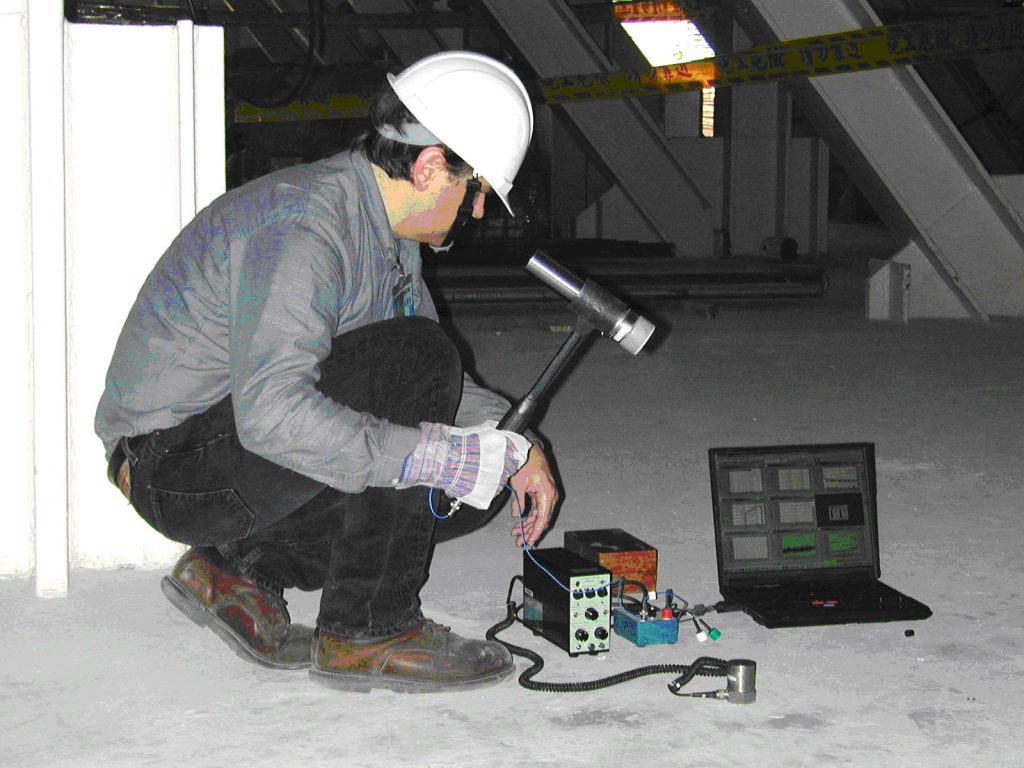
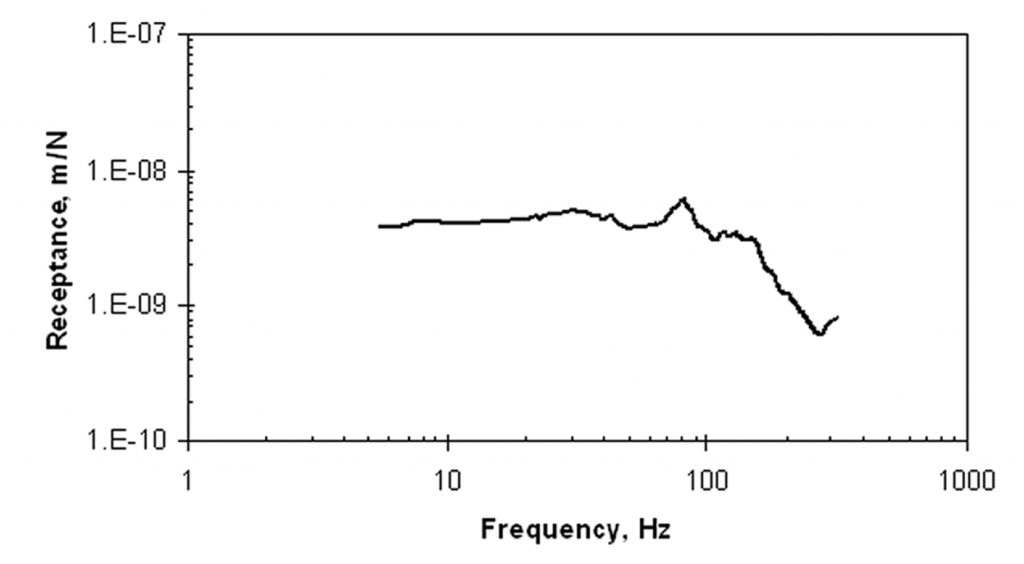
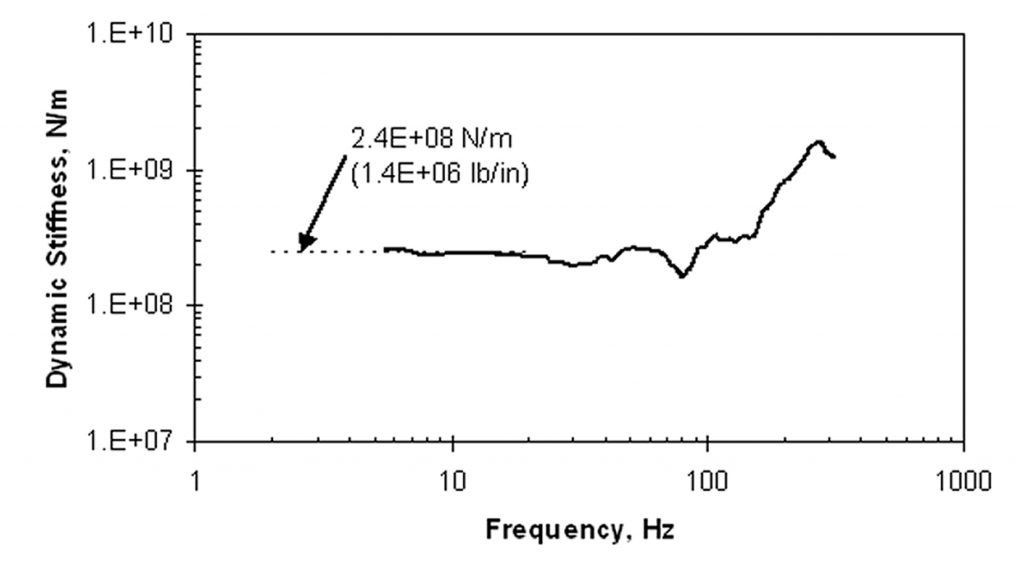
The impulse response of a point on a structure is straightforward to measure with an impact force source, a vibration sensor, and a two-channel spectrum analyzer.2 A hammer equipped with a force sensor may be used to apply an impact force and measure the force created, as shown in Figure 1. An accelerometer, a sensor that measures acceleration, may be used to measure the dynamic response to the impact, and the signal may be double-integrated electronically to create a displacement signal. The spectrum analyzer can sample the force and response signals simultaneously, and produce a receptance spectrum, for example as shown in Figure 2. The receptance spectrum shows the receptance in units of L/F as a function of frequency. The dynamic stiffness spectrum, shown in Figure 3, is the inverse of the receptance spectrum. The static stiffness ks at the point of load application is the asymptotic value of dynamic stiffness at low frequencies, which is shown as the dashed line identified in Figure 3.
As discussed in the next section, the presence of a void of significant size is best identified as a deviation of the spectrum from “normal” for a given slab, which can be defined based upon the statistical range of the dynamic properties. Equation (4) shows that the point stiffness depends on the slab thickness, the elastic properties of the concrete, and the subgrade modulus, all of which may vary over a large area. In order to account for this expected variation of dynamic response for good support conditions, receptance may be measured at a large number of locations, as shown in Figure 4, which represents 22 locations. We see that there are some peaks that represent resonances, but they all lie at frequencies above 70 Hz. The shapes of the spectra below that frequency are virtually identical. The variation in response is summarized in Figure 5 in terms of the logarithmic mean (heavy curve) and the logarithmic mean ± standard deviation of the logarithmic spectra (light curves). The range represented by the light curves will be called the “one-sigma limit.” The average coefficient of variation (COV) of the data at frequencies less than 70 Hz is 52%.
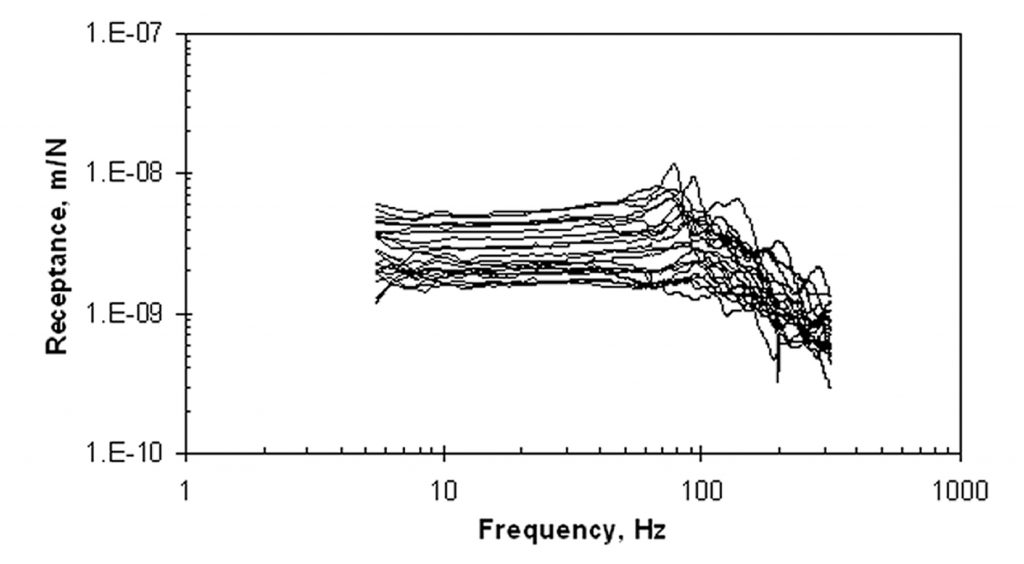
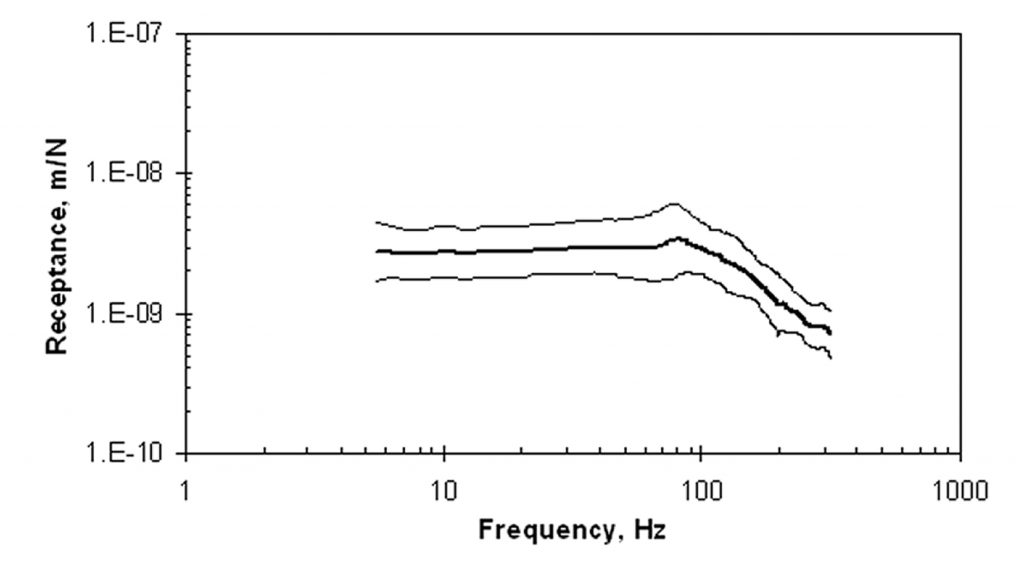
The spectrum of log mean receptance exhibits a characteristic we find typical of slabs-on-ground, though there are exceptions: it may be approximated by two straight lines—one horizontal and the other sloping. In this case, they intersect at about 80 Hz. The slope of the segment to the right of the intersection is approximately one decade per decade (i.e., varying as 1/f ).
Characteristic response of slab with underlying void
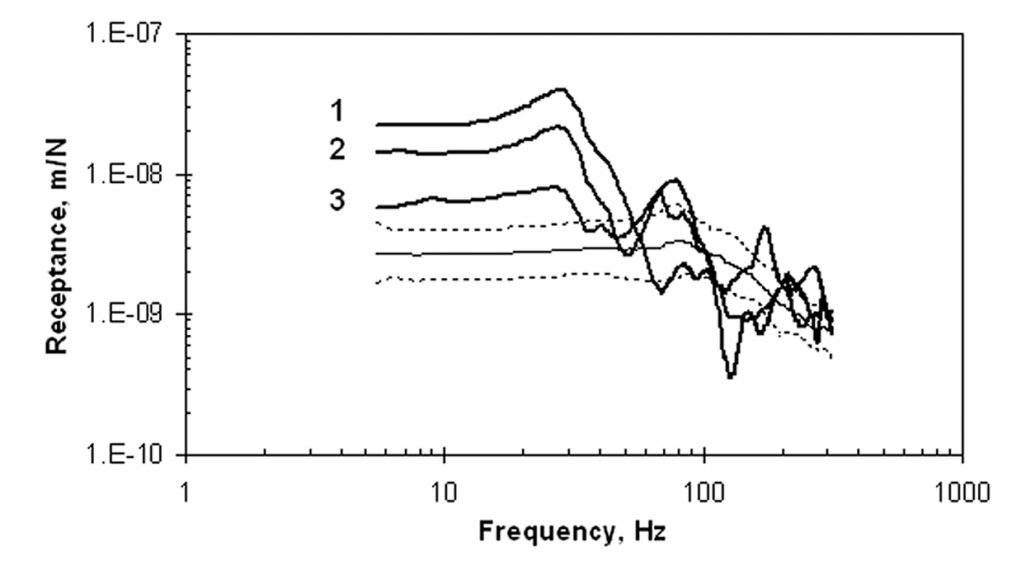
Several locations on the slab were suspected of having experienced curling at the edges, causing the slab to lift off the subgrade, creating a void. The spectra in these areas were not included in the set shown in Figure 4 representing “normal” behavior. Several measurements in one of the curled areas are shown in Figure 6 and are compared with the one-sigma limits of the data measured at locations with normally seated slab. Curve 1 was measured near the “softest” location of the slab, in this case near a corner. Curve 3 was measured much closer to where the slab contacted the soil. Several characteristics may be observed:
- The receptance spectra over the void each exhibit a peak at the same frequency, representing the fundamental resonance frequency of the unsupported slab. In this case it is 29.7 Hz.
- The portion to the left of the resonance, representing the inverse of static stiffness, is significantly higher than the one-sigma limits of receptance for this slab (in this case the stiffness at “1” is about one-eighth of the average stiffness for the supported slab).
- The slope of the segment to the right of the resonance peak is approximately 2 decades per decade (i.e., varying as 1/f 2 ), notably different from the slope of the log mean receptance of the well-founded portions of the slab-on-ground.
It may be adequate simply to confirm the presence or absence of voids. However, in the event that it is necessary to document the lateral extent of a void, this can be carried out by obtaining the receptance spectra on a grid pattern. A low-frequency resonance will be present at all locations over the void, and it will disappear when the slab comes in contact with the subgrade. It is impossible to determine the vertical dimension (i.e., thickness) of the void from these measurements; this will require coring and direct measurement.
Repair of a void
A void below a slab may be filled using grout injection, although significant care is required. If the grout is over-pressurized, the slab can be lifted, causing voids at other locations. However, when properly implemented, the slab is once again brought into solid contact with the subgrade.
The void at the test location represented in Figure 6 was repaired using grout injection by an experienced geotechnical contractor. A collection of 21 50 mm [2 in.] diameter holes were drilled through the slab along the edge where curling had occurred. The holes were spaced about 24 in. [600 mm] apart along the edge, along a line about 600 mm from the edge. At every other hole, a second hole was drilled halfway between the initial hole and the edge. The void space at each hole was measured, and the thickness ranged from 3 to 25 mm.
About 0.1 m3 of fly ash-cement grout was pumped into the void via the core holes. The grout was tested on site to have a 14 second efflux time flowing through a standard flow cone in accordance with ASTM C939. When the pressurized grout traveled to adjacent holes and returned up towards the surface, those holes were plugged. This allowed the grout to migrate to other holes. All holes were patched with a non-shrink high strength grout as recommended by the contractor.
Behavior with a repaired void
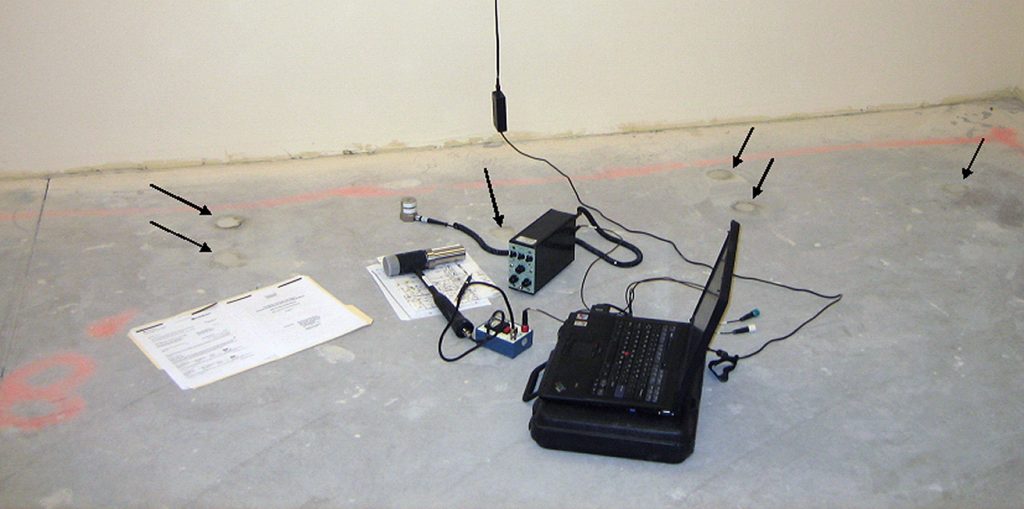
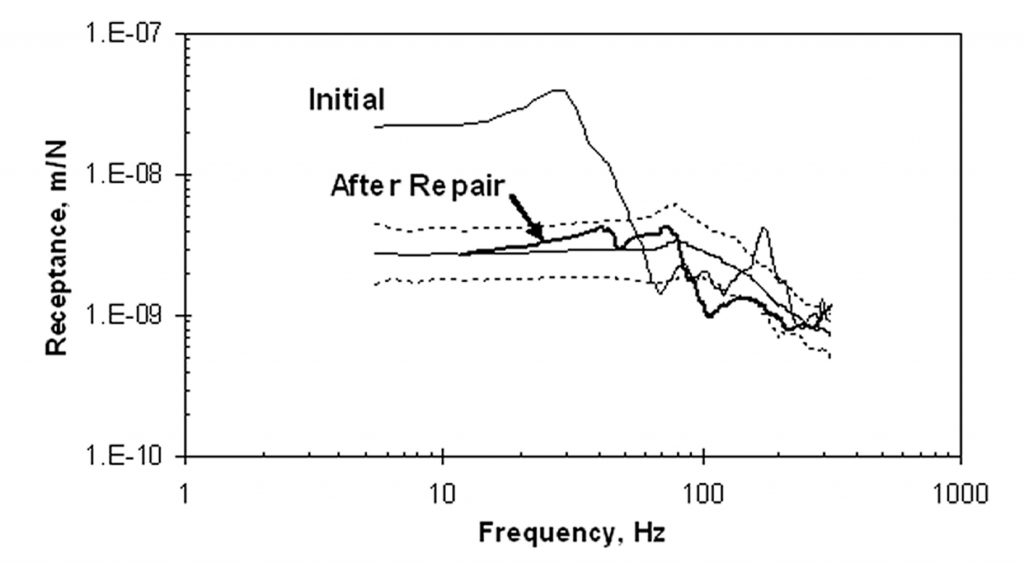
After the grout had cured, impulse-response tests were performed once again to verify the remediation. The locations which had the abnormal receptance spectra were re-tested. Figure 7 shows the test setup at the area associated with the data in Figure 6; the arrows point to the plugged injection holes. Figure 8 shows the pre- and post-repair receptance spectra at the location identified as “1” in Figure 6. The repair led to a measured receptance that was within the one-sigma limits for a normally supported slab. In addition, tests were performed at locations beyond the perimeter of the void, in order to ensure there had been no lifting due to excessive grout pressure. None was indicated.
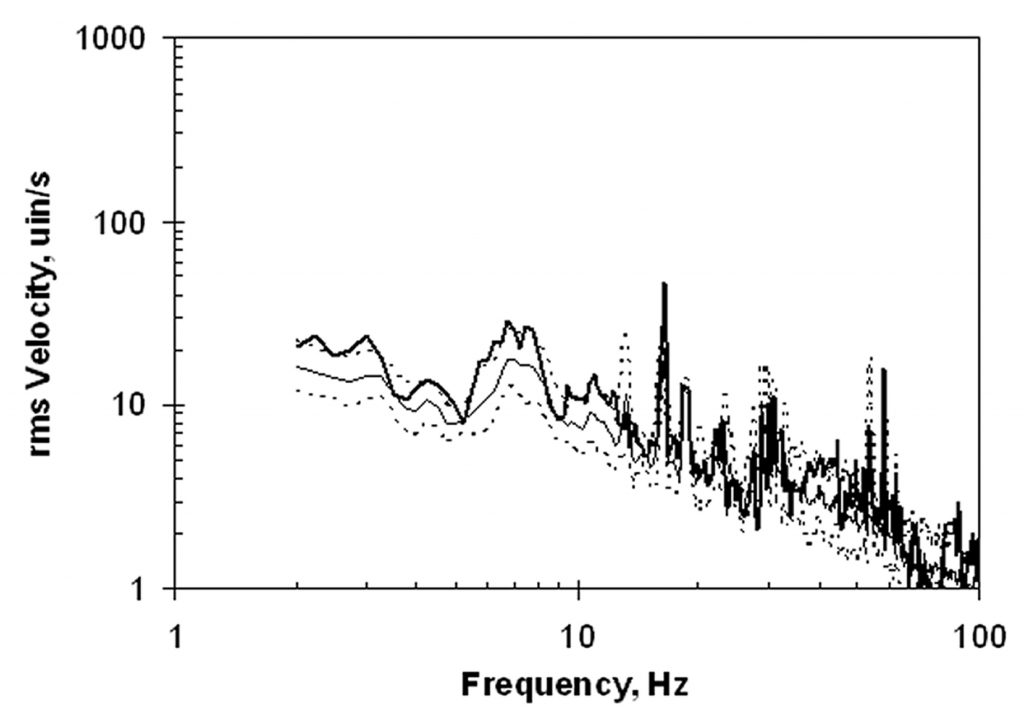
After the slab remediation, the construction was completed. As part of the building commissioning process, a vibration survey was carried out in the laboratory wing of the building. As is customary, the vibration data in the operating facility were characterized statistically using the log mean and one-sigma limits of the survey data.4 Figure 9 shows the post-construction ambient velocity spectrum at the location identified as “1” in Figure 6, along with the log mean and one-sigma limits. The repair led to a measured ambient velocity spectrum that was within the one-sigma limits for a normally supported slab. (The sharp peaks represent the vibrations from rotating mechanical equipment, and their amplitudes are not problematic.)
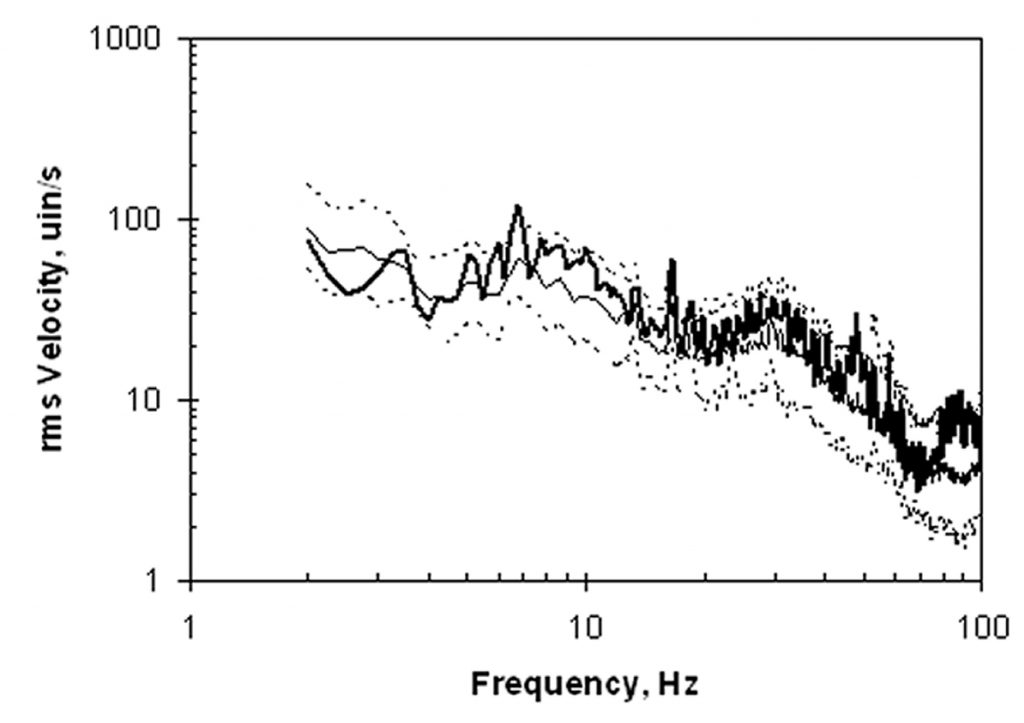
Measurements were also made using footfall excitation, as this was more likely than ambient conditions to excite a floor resonance, if one was present. Figure 10 shows the maximum-hold velocity spectrum at the same location, along with the log mean and one-sigma limits for footfall at all of the measured locations. There are no resonance peaks evident in the data, and the measured footfall velocity spectrum that was within the one-sigma limits for a normally supported slab.
Conclusion
Voids can be created beneath a slab-on-ground when there is curling during curing, subgrade settlement, or washing out of subgrade. Impulse-response has been demonstrated as a means to measure rapidly the low-strain stiffness of the slab-foundation system at a given point. Presence of large voids below the slab are indicated by deviation of the measured impulse-response spectrum beyond the range of normal variation for a fully-supported slab. When voids are found, they may be remediated by careful grout injection and subsequent impulse-response testing may be used to confirm that the voids have been filled.
References
1. S. Timoshenko and S. Woinowsky-Krieger, Theory of Plates and Shells, 2nd ed., McGraw-Hill, NY, 1959
2. K. G. McConnell, (1995). Vibration Testing: Theory and Practice, Wiley, 606 pp
3. ACI Committee 228, “Nondestructive Test Methods for Evaluation of Concrete in Structures” (ACI 228.2R-98), American Concrete Institute, Farmington Hills, MI, 2004.
4. H. Amick and M. Gendreau, “On the Appropriate Timing for Facility Vibration Surveys,” Semiconductor Fabtech, No. 25, March 2005, Cleanroom Section.
Voids-Beneath-Slabs-on-Ground-Using-the-impulse-response-test-to-verify-adequate-slab-support