Abstract
Semiconductor production and other advanced technology facilities are often designed in two stages, delineated as “base build” and “hook up”. The first stage, at completion termed “as-built” by ISO, includes the design and construction of the shell structure and all architectural, mechanical, electrical, and process systems needed to operate the building. The second stage, hook up, includes the installation of the production tools and their local support equipment (dry pumps, piping attachments, etc.). During the design of the project, cleanroom environmental vibration and noise requirements are often assigned for compliance in the as built condition only (before tool hook up), since it is often the case that a different design and/or construction team is involved in the hook up, and the base build design team will have little control of operational vibration and noise levels. This paper discusses typical changes, or maturation, in the production vibration environment after the as built condition. These latter stages are identified by ISO as “at rest” and “operational”. In this case, there is usually an increase in environmental vibration and noise levels with the addition of tools and tool support equipment. The role of maturation in building mechanical equipment is also discussed. Means of controlling the increase in vibration are discussed.
Introduction and Definitions
This paper discusses vibration conditions at the later stages in the operation of wafer fabrication facilities (or fabs). However, the general concepts apply to many types of advanced technology facilities, such as for nanotechnology, biotechnology, health care, physics research, etc.
With the term mature, we generally refer to facilities that have been operation for several years. We wish to identify a state that represents an advanced age in the life of a research or production facility, well after the building design team has turned the facility over to its users and permanent facility maintenance administration. As discussed in this paper, we extend the process or concept of maturation from the as-built stage as defined by ISO,[1] through the usable life of the facility. It is immediately after this stage, when the facility’s owners begin to modify the as-built environment with the addition of research and process tools and their support equipment (local dry pumps, chillers, power conditioning systems, etc.) that important and not-well-documented changes start to occur in the vibration environment.
Also, although as-built is relatively early in the life of a facility, it is at this condition that in practice most vibration design criteria are applied to structures. Traditionally, this is because the design and operating teams may consist of different people or companies. The design team may have little control over the installation of equipment after they have completed and started the base building. From their point of view, it is not practical to design the facility to resist any arbitrary mechanical load placed on it any time after start up of the facility, and more importantly, to monitor the installation process to verify compliance with requirements defined before the structure was in operation.
On the other hand, from the standpoint of the eventual users of the facility, compliance with research and process equipment manufacturer’s vibration specifications are required in the as-built condition as well as in the mature facility, since this is the environment in which the equipment will operate. The users will be largely responsible for maintenance base building mechanical equipment and the addition of new building and research equipment that can affect the mature operating environment of the facility.
That said, it is desirable to establish to the degree possible some coordination of process and research equipment installation concepts during the design stages, to reduce the impact from changes that will occur in the mature facility. This includes establishing general lab layout concepts, hook-up piping and support equipment isolation schemes, principles for selecting low vibration equipment, etc. It may be possible at this stage to identify exclusion zones for certain classes or power ratings for mechanical equipment to minimize impact.
The importance of base building maintenance must also be emphasized. From a mechanical standpoint, dynamic balance requirements for equipment and vibration isolation for equipment and piping may be established to meet the as-built design requirements. Out-of-balance forces will increase over time, and vibration isolation can become dysfunctional or at least partially so (especially with the use of poor quality isolators), and these will increase the vibration impact to the process areas.[2] From a structural standpoint, end users must have some understanding of certain special vibration design features, such as structural isolation breaks, dynamic loading requirements, etc., so that these are not accidentally compromised in later installations and retrofits.
Characterizing the As-built State
At the as-built stage, the building’s structure is complete and its mechanical equipment is operating. In this condition, the relatively stiff floors that support particularly sensitive processes or research should be performing in compliance with their as-built vibration design criteria. The vibration spectrum in this case tends to be essentially broadband[3],[4] in character (more or less synonymous with “random”) due to the presence of turbulent sources such as fluid flow in piping and ductwork. For suspended floors in particular, this broadband vibration tends to be highest at frequencies corresponding to modal frequencies in the composite and individual structural elements (floor membranes, columns, floor ribs, etc.).4,[5],[6] Overlaid on top of this broadband spectrum may be some tonal (single-frequency) vibration components associated with rotating mechanical equipment.
It is reasonable to characterize the vibration environment at a particular tool’s location using vibration data measured only at that location (or multiple locations within the footprint of that tool). However, one will find significant variation of the vibration environment over the extent of a large, vibration-sensitive space.[7] How do we characterize a large area? In order to represent a large area in its entirety, one must work with data from a “statistically significant” number of measurement locations.[8]
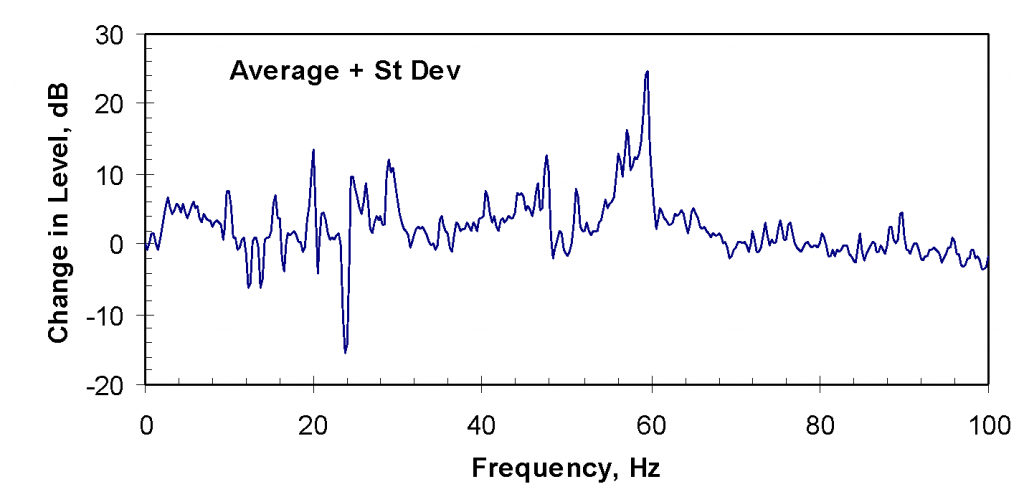
If we use the average of this collection of data, then about half of the space would exceed this value, and there would be no representation of the scatter of the data. Thus, we have evolved a practice when evaluating a large space that involves taking measurements at a statistically significant number of randomly selected locations[9] distributed over the space. We then subject the data to logarithmic statistical analysis (usually in terms of decibels re some reference), and characterize the space using the spectrum representing the log mean (or log average) plus the log standard deviation (also known as the “average-plus-sigma” or “Average + St Dev” case—dropping the “log” term, but implying its use). Thus, the resulting spectrum represents the majority of the space, though it will exclude extrema. When we present the data for the first time in a report, we will show the spectra representing the maximum, minimum, mean, and the mean plus one standard deviation, as shown in Figure 1. The Average + St Dev spectrum, when expressed in the appropriate form, is what we use to characterize a facility and to compare with its criterion. We also use it when making comparisons over time or between spaces.
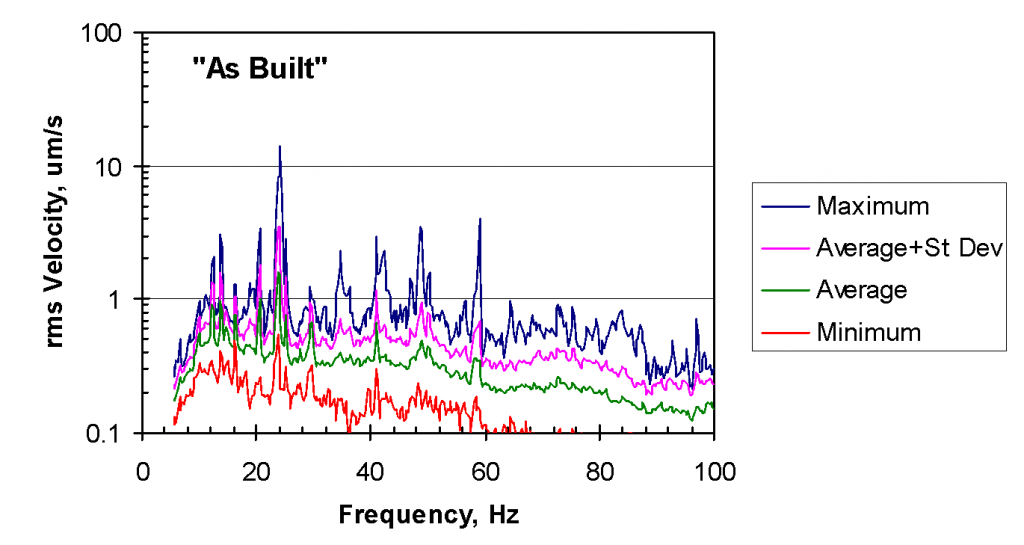
Figure 1 contains a statistical summary of vertical vibration spectra[10] collected at many locations distributed over the area of a wafer fab process floor in the as-built operating condition, illustrating the various components of the vibration discussed earlier.
Characterization After the As-built State
In theory, process and research tool installation begins after the as-built state is reached. This activity generates primarily transient broadband or temporary deterministic[11] vibrations, very similar to typical vibration due to construction activity. Sources of vibration include movement of equipment and materials (broadband transients), dropped loads or other impacts to the structure, power tools (transient or short-term tonal or broadband impacts), etc. This is a temporary state, although it may recur occasionally in the future as research or production equipment is installed or upgraded.
ISO1 defines the subsequent state—with these tools installed but not operating—as “as-rest”, and as “operating” when they are operating. In the operating phase, new continuous and transient vibration sources are operated in the facility. These include the process and research tools themselves, and their mechanical and electrical support equipment, such as electrical power conditioners, dry pumps, chillers, environmental unit fans, etc. The hook-up piping associated with these sources is also now in place. The vibration types are broadband (flow in hook-up piping), tonal (rotating mechanical equipment such as pumps and fans), and transient (robotics, automatic materials handling systems, etc.). The vibration environment during this phase is relatively constant in processing facilities, or may change somewhat depending on the equipment in use in research areas.
The next phases may be associated with the ageing of the facility. Changes in the vibration environment at this stage may be more or less subtle, and are associated with:
- the need for maintenance of building mechanical equipment (e.g., machine dynamic balance, adjustment of vibration isolators)—this tends to increase the vibration, at least until adjustments are made;
- curing (strengthening) of concrete—as the vibration performance of a facility is proportional to concrete stiffness (which increases with strength over time), this would tend to improve the vibration environment;
- and any changes (additions, removals, maintenance, or replacement) in the operation of the equipment that power the building, or the tools.
Comparison of As-built versus Operating Vibration Environments
Figure 2 shows a statistical summary of the data collected at the same locations in the building represented in Figure 1, now 20 months later and after the tools are in place and operating. This represents a continuous operating phase, without any installation transients.
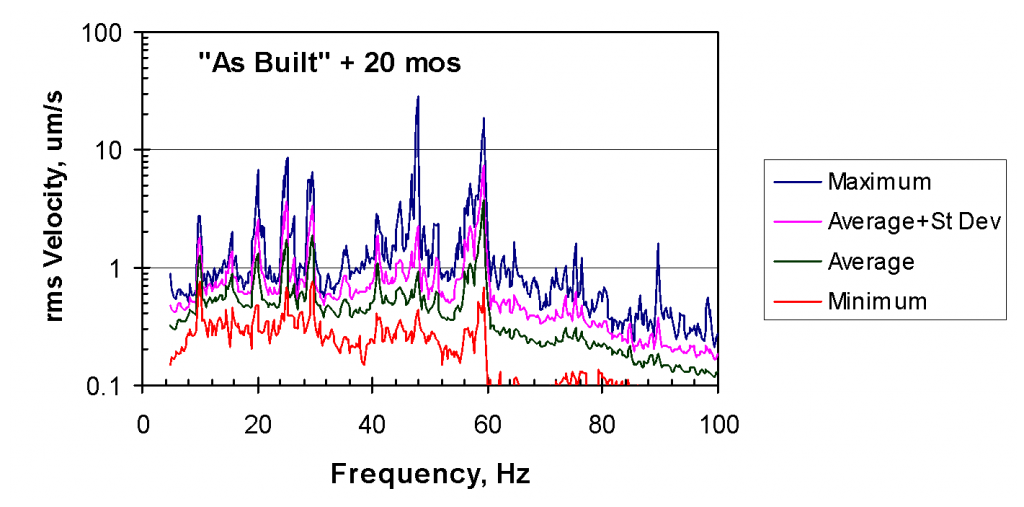
Figure 3 compares the average-plus-one-standard-deviation amplitude of the vibration environment in the two conditions. There are several significant differences, and detailed evaluation of this facility showed that with one exception[12] the changes in vibration environment were due to the added tools and tool support equipment.
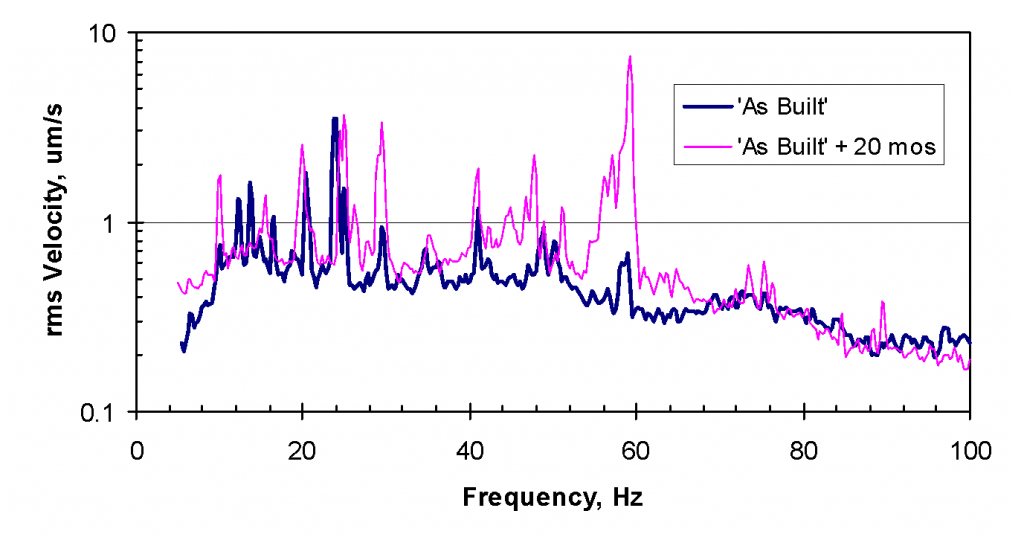
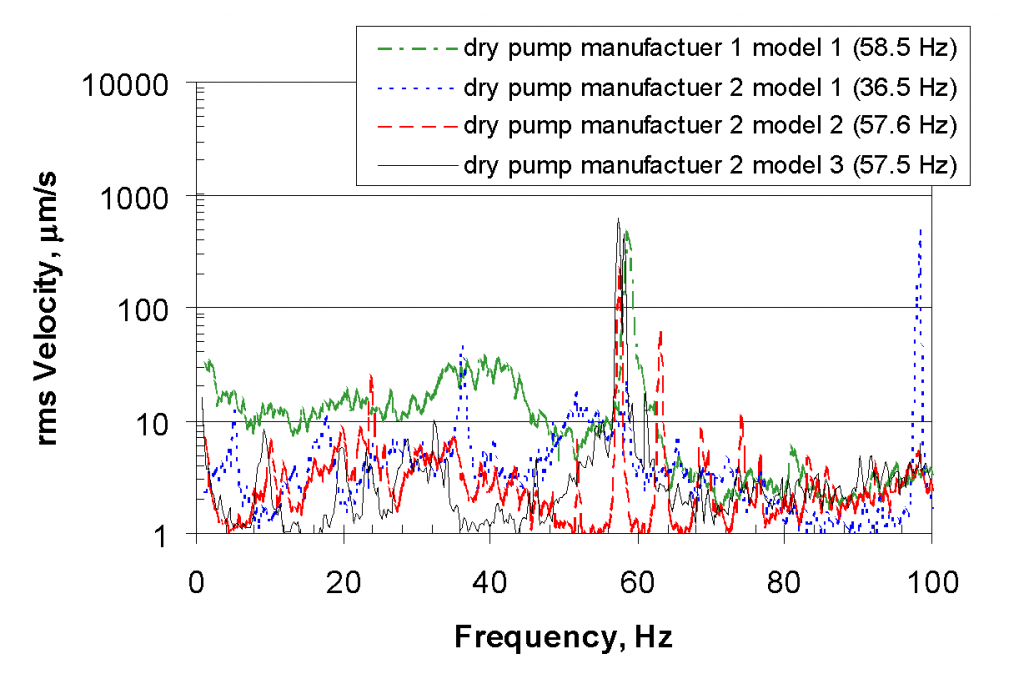
The most significant change occurs at frequencies just below 60 Hz. This vibration has been traced to the many (hundreds in this case) dry pumps and local chillers located one level below (at “sub fab” level). This vibration is tonal in nature, and varies in frequency slightly from model to model, but generally occurs between 56 and 59.75 Hz (3360 and 3585 rpm) in facilities operating with 60 Hz mains frequency. Some of this equipment, such as small scroll pumps, is also the source of the significant tonal vibration just below 30 Hz (1800 rpm). The increased broadband vibration between 3 and 70 Hz is most likely associated with fluid flow in hook-up piping and exhaust ducts, and with wafer handling systems.[13]
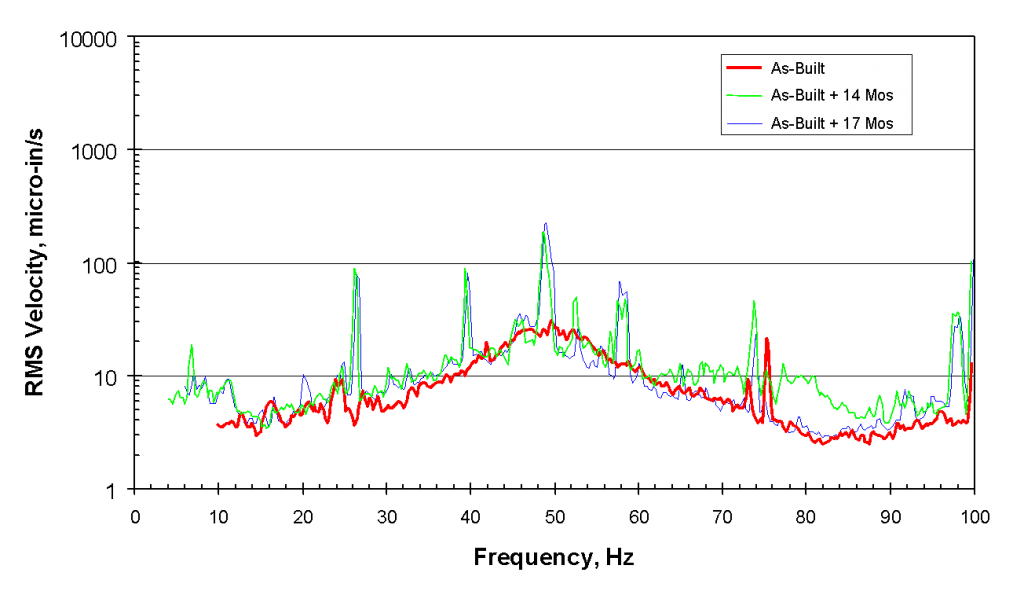
Figure 4 shows a similar comparison of as-built versus operating vibration in another facility. In this case, the mains frequency is 50 Hz, and the tool support equipment generates tonal vibration just below the mains frequency between 48 and 49.75 Hz (2880 and 2985 rpm). Vibrations have also increased at other discreet frequencies due to tools and hook-up equipment. In addition, there has been a small increase in the broadband vibration amplitude throughout the measured frequency range.
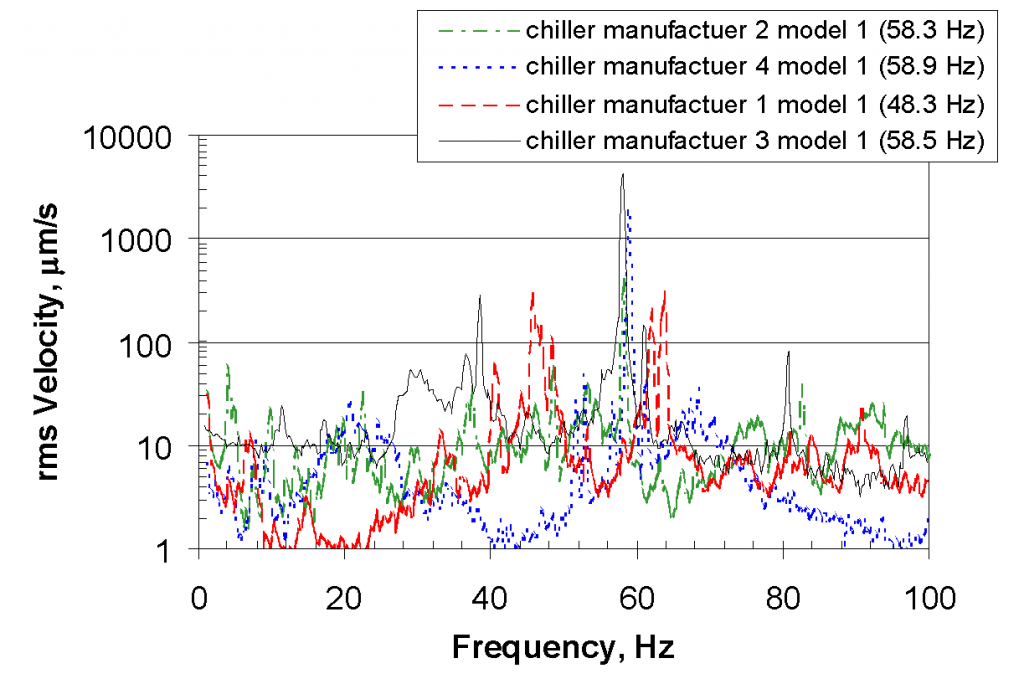
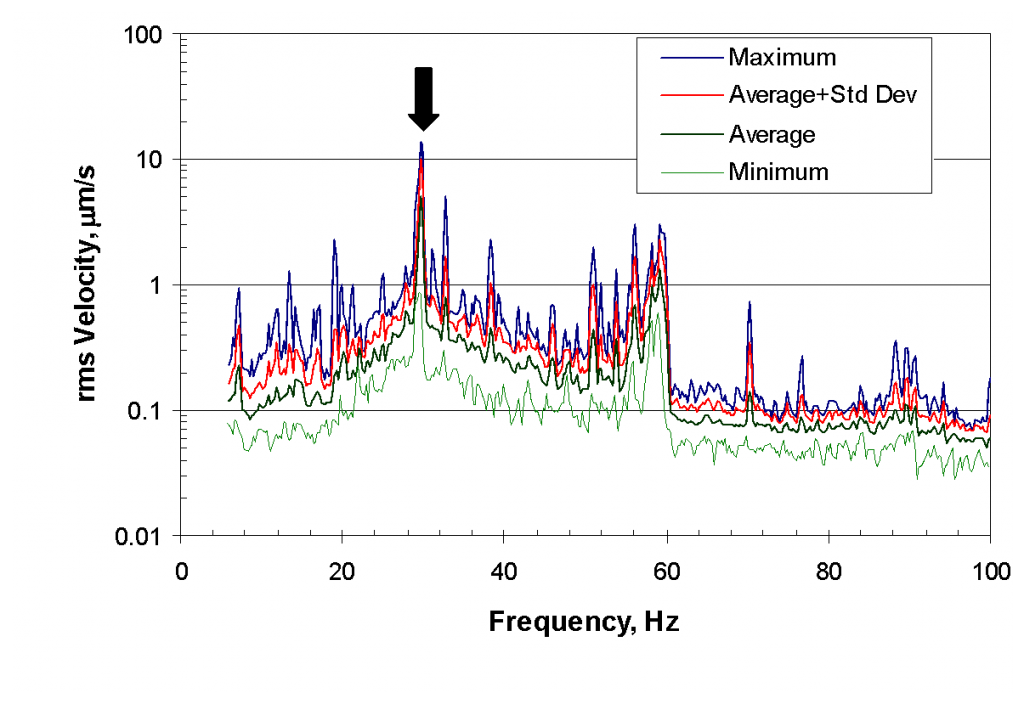
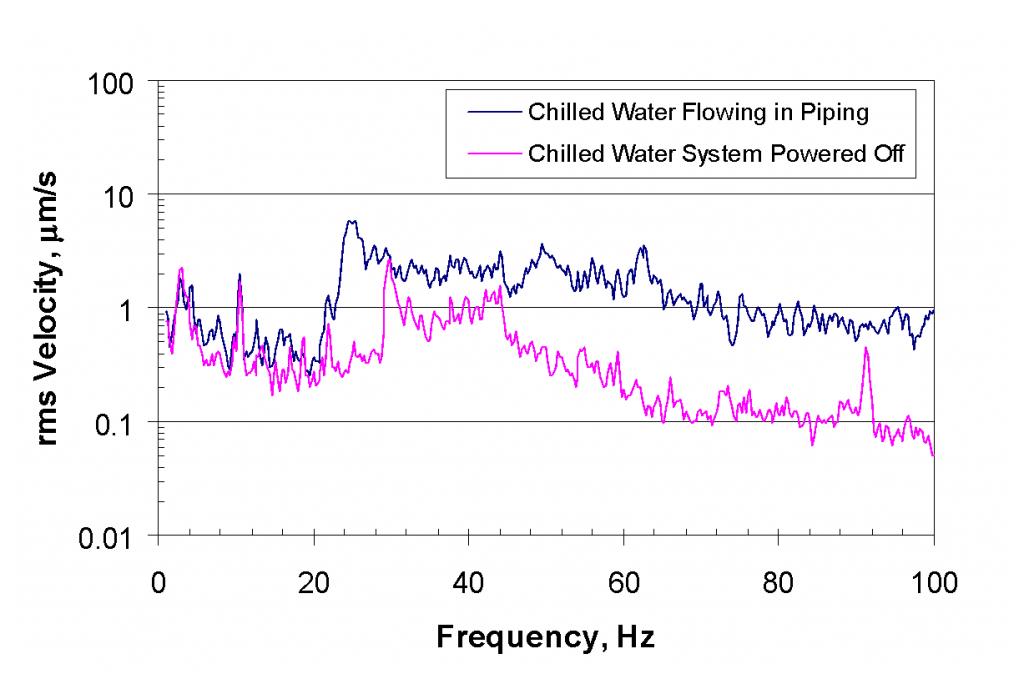
Figures 5 through 8 illustrate the characteristics of some of the vibration sources discussed above. Measurements made on the casing of several dry pumps and several chillers placed in the subfab to support specific tools are shown in Figures 5 and 6, respectively. The tonal signatures of these groups of equipment are evident. Figure 7 contains statistical spectra from an operating process floor which is dominated by tonal vibration at 30 Hz due to one of the process tools, in this case an ion implanter. (This plot also shows the characteristic hook-up equipment group tonal impact just below 60 Hz.) Other tools that generate vibration include CMP tools, SRD (Spin Rinse Dry) and other cleaning processes, and various types of assembly tools (laser drills, bonders, die cut, etc.). Finally, in Figure 8 we show the vibration amplitude on a process floor in a wafer fab with a variation in the flow velocity in the cooling water system. There is a marked increase in broadband vibration associated with the change in flow velocity.[14]
Characterizing Maturation
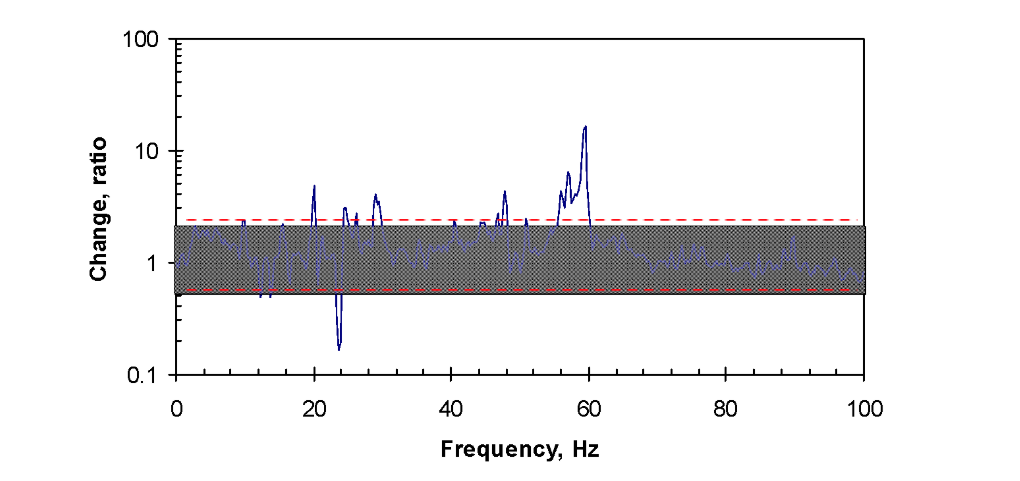
Returning to the data from the facility illustrated in Figures 1 through 3, we can provide an estimate of the “normal variation” (or, generally, normal increase) in vibration due to the addition of the tools within a semiconductor production facility. If we take the product of the average-plus-one-standard-deviation data shown in Figure 2 (“As Built + 20 Months”) divided by that shown in Figure 1 (“As Built”), the result is as shown in Figure 9. These data are shown in terms of decibels (dB), as defined in Equation (1).

(1)
We can assume that some range (say +/- 6dB) is “normal variation”.[15] This corresponds to the area between the dashed lines in Figure 10, which represents the change in terms of a factor defined by Equation 2, rather than decibels. The spikes that extend above what might be defined as normal variation represent the frequency ranges in which we have the most significant changes in vibration associated with maturation. The majority of this vibration due to user-supplied equipment is near 60 Hz, as shown in the figure, as discussed above. (Refer to Note 12 for a discussion of the dip at 24 Hz, which is an artifact.)

(2)
Implications
The data shown illustrate that the vibration in advanced technology facilities can increase significantly from as-built design amplitudes with the introduction of research and production equipment. The increases may also be due to other factors, such as ageing and maintenance of the building mechanical equipment and structures. The following are implied:
- The layout, design, and isolation of tools and tool support mechanical equipment and piping can significantly influence the eventual operating vibration environment. Thus, it is incumbent upon the facility and tool owners—when installing new equipment—to carry through with the same level of conservatism employed in the installation of base-building equipment. Failure to do so almost guarantees degradation of an otherwise good vibration environment.
- Periodic maintenance and inspection of building mechanical equipment balance and isolation systems are critical in the maintenance of design vibration conditions in the process environment. Due to cost constraints, conservative “over-design” and layout is rarely possible in the base building design.
- The performance of the vibration-sensitive floors under mechanical load are to a significant degree a function of the stiffness of those structures.5 Thus, a compensating structural design factor in structural stiffness to reduce impact from operating vibration can be considered. It is unlikely to be practical to provide enough stiffness to compensate for all of the excess vibration shown in Figure 10, however. If better performance is required, an appropriate combination of improved tool support equipment isolation and compensating stiffness may be the best option.
Endnotes
-
ISO 14644-4:2001, “Cleanrooms and associated controlled environments,” defines this state as “all construction is complete, all services connected and functioning but with no production equipment, materials or personnel present.” It is difficult to fix the as-built state at a particular point in time because the construction of many facilities now involves the start of tool installation before the facility is fully balanced and then in the condition implied in the as-built state. ↑
-
The use of vibration isolation can generally be thought of as a compromise solution in a situation where it would be desirable to locate the source further from the sensitive area, but this cannot be done for practical reasons, such as cost, thermodynamic and other energy losses, etc. From a vibration standpoint, this compromise is detrimental because of the isolation maintenance implications, whereas a source located at adequate distance such that isolation is not required can be largely ignored. ↑
-
Amick, H. and S. Bui, “A Review of Several Methods for Processing Vibration Data,” Proc. Intl. Soc. for Opt. Engng. (SPIE), Vol. 1619 (Nov. 1991). ↑
-
Amick, H., “On Generic Vibration Criteria for Advanced Technology Facilities: with a Tutorial on Vibration Data Representation,” J. Inst. Env. Sci., pp. 35-44, (Sept/Oct, 1997). ↑
-
Amick, H., and A. Bayat, “Dynamics of Stiff Floors for Advanced Technology Facilities,” Proc. 12th Engrng. Mech. Conf., American Society of Civil Engineers, pp. 318-321, (May, 1998). ↑
-
H. Amick, M. Gendreau, and A. Bayat, “Dynamic Characteristics of Structures Extracted from In-situ Testing,” Proc. Intl. Soc. for Opt. Engng. (SPIE), Vol. 3786, Denver, CO (July 1999). ↑
-
A thorough discussion of the reasons behind this variation is beyond the scope of the present paper. However, the primary reasons are the spatial relationships between sources and measurement locations, and the position of each measurement location within a bay. In general, there will be a difference in spectral content as one moves from the middle of a bay to one of the columns supporting that bay, simply because of the relative location within the family of the floor’s modeshapes. ↑
-
There is no fixed definition of this quantity. We usually select between eight and twenty locations, depending upon engineering judgment and time available. ↑
-
The intent in this random selection is to avoid a particular pattern that would introduce some of the systematic variation due to modeshapes. In other words, we don’t want a disproportionate number of midbay locations, near-column locations, or any other particular location within a bay. However, we do want some midbay and near-column locations, because at many frequencies the extrema will occur at these locations. ↑
-
We present vertical statistics separate from horizontal, and we usually present two sets of horizontal statistics, one for each primary orthogonal direction (usually the building’s nominal north-south and east-west axes). Vibration from any one of these axes would serve to illustrate the phenomena discussed in this paper. We have limited the discussion to vertical vibration for simplicity. ↑
-
Deterministic vibrations are predictable vibrations, the opposite of random vibrations. A steady-state sinusoidal (or tonal) vibration is deterministic. ↑
-
There are several tones between 12 and 16 Hz and near 24 Hz that are due to building mechanical equipment (pumps and fans) that operate on variable frequency drives and have changed operation speed in the interval. ↑
-
It is also possible that this effect might, in some cases, be due to increase fluid flow velocities in the building main and secondary piping and duct systems. However, in this case, an attempt was made to “false load” these systems during the as-built evaluation, in order to capture the effects of design flow velocities. This is critical because the vibration impact from these systems is proportional to the flow velocity. ↑
-
The system changed in this illustration is actually associated with the base building design, and is used here only to illustrate broadband vibration impact. Such an increase might also occur due to, for example, vibration associated with improperly isolated hook-up piping not present in the as-built condition. ↑
-
This range is admittedly arbitrary, but is consistent with our observations of data. We have not yet been able to examine enough fabs in a historical context to be able to have a more specific range that is representative of reality. In the example case, the mean change is an increase of 2.3 dB—essentially a log mean—and the standard deviation () is 4.3 dB. Thus the mean corresponds to the range –1.9 to +6.6 dB. Since the notion being discussed infers that “abnormal” maturation is that which is greater than the “normal” range, there is little practical difference from the arbitrary range of 6 dB. ↑
Gendreau, M. and H. Amick, “’Maturation’ of the Vibration Environment in Advanced Technology Facilities,” J. Institute of Environmental Sciences and Technology (2005).
cc3f3d6f08b31b5bb4432ef47459dc8a-3