ABSTRACT
Electron beam-based instruments, and other high-resolution instruments, are sensitive to the environment in which they operate. Adverse environments may limit achievable resolution. Equipment manufacturers provide specifications defining acceptable amplitudes of various environmental contaminants, such as vibration, electro-magnetic energies, and acoustic noise. However, the quality of these specifications varies significantly, from well-defined to conjectural. Additionally, in the design of a laboratory, the specific instruments that will be used may not yet be known. In these cases, in the design of facilities that will contain them, “generic” criteria, intended to represent entire classes of instruments, are useful. Generic vibration criteria exist to aid in the design of laboratories and cleanrooms, for example, although there are no such generic acoustic noise criteria for sensitive instruments. The generic noise criteria that are currently used in lab design (NC, NR, dBA, etc.) were established to address the effects of noise on humans. In the subject study, a correlation of achievable resolution with allowable environmental noise (based on manufacturer’s noise specifications for a significant number of instruments with varying resolving powers) demonstrates the direct and general relationship between acoustic pressure and instrument resolution. The frequency basis of this relationship validates important principles that would be neglected with the application of human hearing curves: there is a variance in frequency response, and noise at infrasonic frequencies is more significant. Based on the data reviewed, generic noise criterion curves have been developed and are presented for use in the design of facilities that contain noise-sensitive equipment. As criteria based on statistical analyses of a significant population of data, we propose that they may be considered “generic,” and applicable when other well-defined and specific criteria are not available.
HISTORY AND IMPETUS
Because of the often random (but statistically stationary) nature1 of environmental phenomena that influence the reliability and accuracy of processes sensitive to them, and of uncertainty in the determination of limits in metrological work (and especially the limited specificity of human perception when it is a factor), it is common to use so-called “generic” criteria to represent or delimit groups of varying members. Examples are the use of “dosage” to represent the effects of noise or radiation on humans, or the conception of “annoyance” as used by acousticians, which attempts to resolve several types of variables (physical and psychological) into a group of single-number indices to represent likely responses. In addition to simplifying the representation of data (such as the summation of a noise spectrum into its overall A-weighted value, incurring the loss of potentially valuable information), such methods may be used to represent information that is not presently known or not knowable, such as the vibration sensitivity of an undeveloped metrology tool, but for which limits must necessarily be set in order to carry out the design of the building that will support it.
In some of the examples given above, the generic index represents an average response. One may also define indices that represent with a high probability that all responses will be at or below a particular value. Specific examples are the selection of a noise criterion that would give a high probability that most people using a space for, say, reading, would find it a satisfactory environment for that activity, and the selection of a vibration criterion that all of a class of instruments for, say, photolithography production at 65nm linewidths, will be acceptable2. The latter case may be defined as more significant in the sense that a reader with concentration problems can move to a quieter location (and some do better in noisier environments anyway), but a 12,000 kg photolithography scanner requiring an ISO 14644-1 Class 4 cleanroom environment has fewer options for locations to work in. (This argument is not one of man versus machine, as the present example might have implied; depending on the circumstances either one can be the more forgiving. A reverse example would involve ionizing radiation.)
The present essay regards the development of generic acoustic noise criteria for noise-sensitive equipment (or “tools”), such as those used in physics and nanotechnology research, semiconductor production, etc. By way of analogy it is useful to consider the development and current adaptation of the generic “vibration criterion” (VC) curves commonly used in the identified industries to design and rate the environmental vibration performance of the floors upon which such work is carried out3. They were developed by collecting and sorting the tested vibration sensitivity frequency response spectra of various types of tools, which necessarily are relatively complex and varying as a function of the various structural designs of the tools4. The VC curves represent the maximum sensitivity of groups of tools, distinguished approximately by process type and operational resolution. They have proved useful not only in representing similar tools in the same class for which tested sensitivity data do not exist, but also in designing buildings for future tools with assumed greater accuracy or resolution and of similar or greater environmental sensitivity5.
In fact, the use of generic curves for rating and designing rooms for acoustic noise is as varied and common as those used for vibration, and perhaps more so. The primary difference is that the many types of noise rating curves available (NC, NCB, NR, RC, etc.) were developed with respect to human perception rather than instrument sensitivity (although there are vibration curves for the former purpose, and even the VC curves are related to a set of higher-amplitude perceptivity curves). Unlike vibration, to which instruments and people are primarily sensitive in the same frequency range (approximately 1 to 100 Hz), noise impact on people and instruments occurs in different (but overlapping) frequency ranges. People are primarily sensitive in the mid- to high-audio frequency range (approximately 100 to 10,000 Hz), whereas instrumentation is primarily (with exceptions) sensitive in the 100 to 1000 Hz range, and sometimes lower into the infrasonic range (100 to 10 Hz and below) depending, for example, on the presence of exposed beams or air bladders6 sensitive to air pressure fluctuations. Thus, while it is currently common to use perception-based curves such as NC or NR to design and evaluate rooms for tools and instrumentation (in addition to their designation for humans), they may not well represent the general shape of the curves actually required for groups of tools or specific tools, which would influence the cost, practicality, and effectiveness of the design. That is, the use of curves designed for humans might produce over- or under-designed rooms for instruments, at certain frequencies7.
THE CURRENT STATE OF AVAILABLE NOISE SPECIFICATIONS FOR TOOLS
One of the primary reasons for developing generic noise criteria for tools is that the accuracy and reliability of the sensitivity data for individual tools varies widely. For example, a survey of the available data on a particular type of instrument known to have sensitivity to noise in many cases, such as transmission or scanning electron microscopes (TEM and SEM), would produce instruments for which tested, reliable, and detailed noise sensitivity data exists; others for which the noise sensitivity has only been estimated; and others for which the specific sensitivity is unknown, except perhaps by anecdotal evidence such as “nearby talking causes interference.” It is difficult to make reasonably accurate assumptions about the actual sensitivity of the latter instruments, given that the detailed test data available for other similar instruments may show significant variation in sensitivity from instrument to instrument. One of the goals in the development of generic sensitivity curves is that unknown tools may also be represented by a curve drawn through the points of maximum sensitivity of known tools of the same class and operational resolution. This goal is achievable given the assumption that the requirements of unknown tools would likely fall within the range of variation for the group of tools for which we have good data.
Even when tested data have been provided for a tool, the details of the test are rarely available. This would be useful to determine the accuracy of the test. Typically, such tests are carried out by exposing the tool to various noise levels at various frequencies and noting the amplitudes at which the noise causes reduced operational resolution of the tool8. If the test is not carried out carefully and with adequate understanding of the mechanisms that allow noise to affect tools, the accuracy of the test may be compromised. For example, harmonic distortion in the test instrumentation (amplifiers, speakers, etc.) or induced vibration in the structure supporting the instrument may cause misrepresentation of the tool’s sensitivity to infrasound.
The formats of the available test data vary significantly. It would be preferable that the data be provided in octave band frequency resolution at least, and this is the format of the primary data used in this study. The strange practice of expressing these frequency spectra in terms of human perceptual weighting networks (e.g., dBC), which is surprisingly common, is a useless deviation, and they have been “unweighted” before use in the present study. Spectra provided in one-third octave bands have been converted into octave bands using the level of highest sensitivity (lowest amplitude) of the three bands to represent the corresponding octave band.
FORMAT OF GENERIC TOOL NOISE CRITERION CURVES
The format of generic tool noise criterion curves (hereafter abbreviated “NCT”) must be developed from practical considerations:
- They will be expressed in logarithmic units of sound pressure (dB re 20 micropascals), which is the most common and most easily measured index for noise.
- They will be expressed as frequency spectra, with a resolution of octave bands of frequency. (Higher resolutions are always preferable, and reducible to octave bandwidths when necessary.)
- There will be no frequency weighting based on human perceptual indices.
- The practical frequency range, from the standpoint of available information on noise-producing equipment and noise control materials, is 63 Hz to 8000 Hz. However, it will be necessary to consider lower frequencies, as discussed below. It will be preferred therefore, that the first-order curves rate noise within the audio range, and that there be contingent extension of the curves to lower frequencies when needed. That is, it is expected that there may be a variance in curve shape for tools with and without significant sensitivity to infrasound. Because of the lack of acoustical design data below 63 Hz, it will be understood that design for this region requires special considerations.
- There is a practical lower limit in amplitude, as a function of frequency, in terms of achievability, and of measurability using commercially available equipment. Beyond this limit (and preferably even approaching this limit), manufacturers will have to provide tools less sensitive to acoustic noise by innovation and good engineering practice.
With regard to frequency resolution, consider the following. Given the choice, it is always better to have excessive information than inadequate information. Excessive information can be reduced to the required information. In the opposite case the assumptions necessary to expand the data decrease accuracy. In cases where there are adequate resources for higher-level engineering work, one might, for example, be able to design for a tool that is sensitive at a specific narrowband frequency by using Helmholtz resonant absorbers, or select a fan with a blade passage frequency other than at those preferred by a sensitive space or structure. However, in most practical cases, one would be using traditional acoustical materials (silencers, absorption products, barriers of specific transmission loss), and mechanical air moving and transmission equipment (fans, ductwork, terminal boxes, diffusers), all of which are most commonly rated in octave bands of frequency in the audio range. (In addition, designing spaces for compliance at single or multiple narrowband frequencies is not conducive to future expansion or retrofit that may involve other sensitive equipment.)
DEVELOPMENT OF CURVES BY COMPARISON WITH TOOL SPECIFICATIONS
When it is not possible to obtain tool sensitivity test reports thorough enough to contain a description of the test details and error analysis, as is unfortunately most often the situation, we must make assumptions about the specifications presented in tool manufacturer’s installation manuals. It is somewhat conjectural to state that believable tool noise sensitivity spectra have certain characteristics, such as a “jagged” shape implying the expected sensitivity at certain discreet frequencies, but this is often the case. It is also possible that some manufacturers have chosen to simplify such response functions by identifying a straight line that asymptotes to one or more minimum values in the actual performance curve (indeed, a similar method is proposed in this essay). The present analysis is based on sensitivity spectra that are known (or at least appear) to represent measured frequency response functions. Non-rigorous specifications may then be compared for consistency to the generic curves developed (e.g., by converting them to dBA, dBC, NC, etc. as necessary)—this is relevant since some tool manufacturers grant warranty on this basis, despite the lack of definition.
COMPARISON OF TYPICAL TOOL NOISE SPECIFICATIONS WITH SENSITIVITY CURVES BASED ON HUMAN PERCEPTION
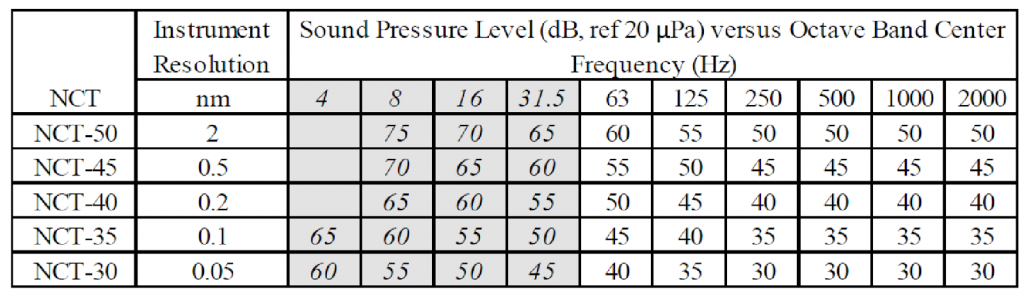
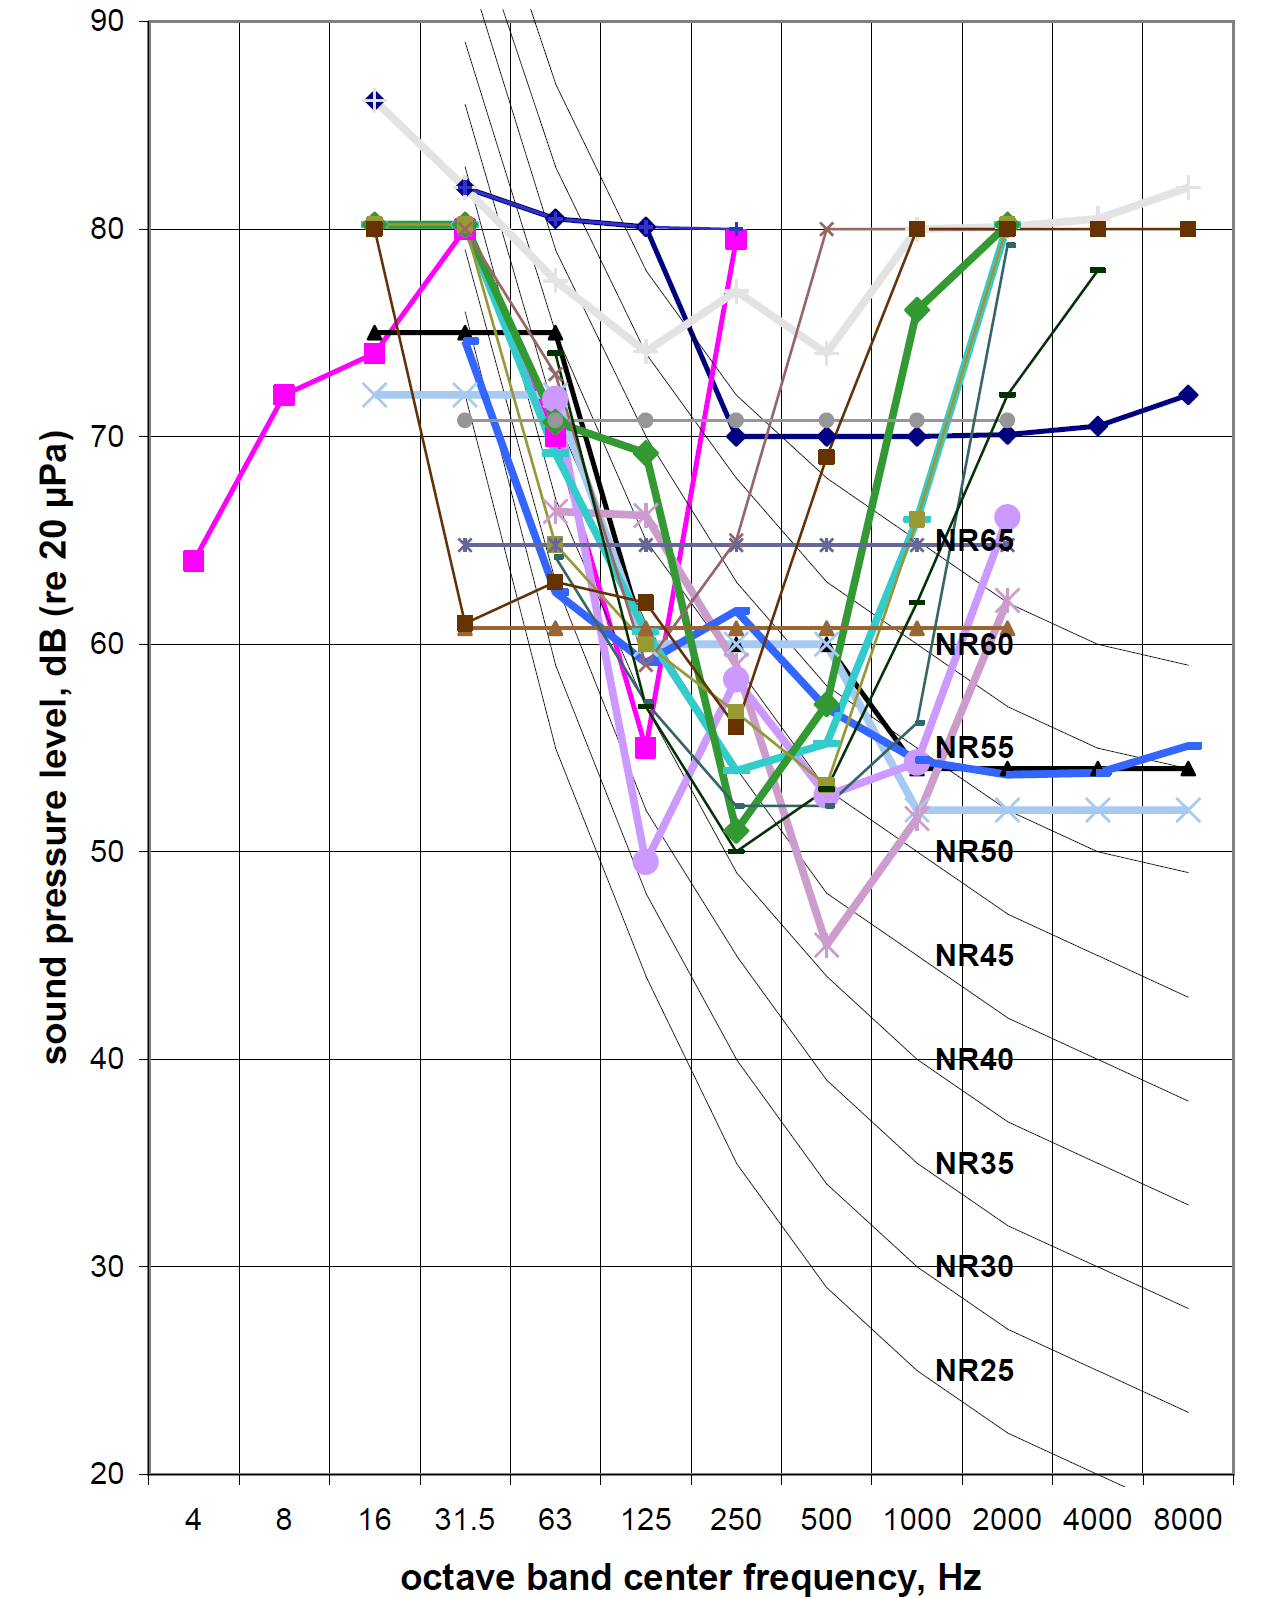
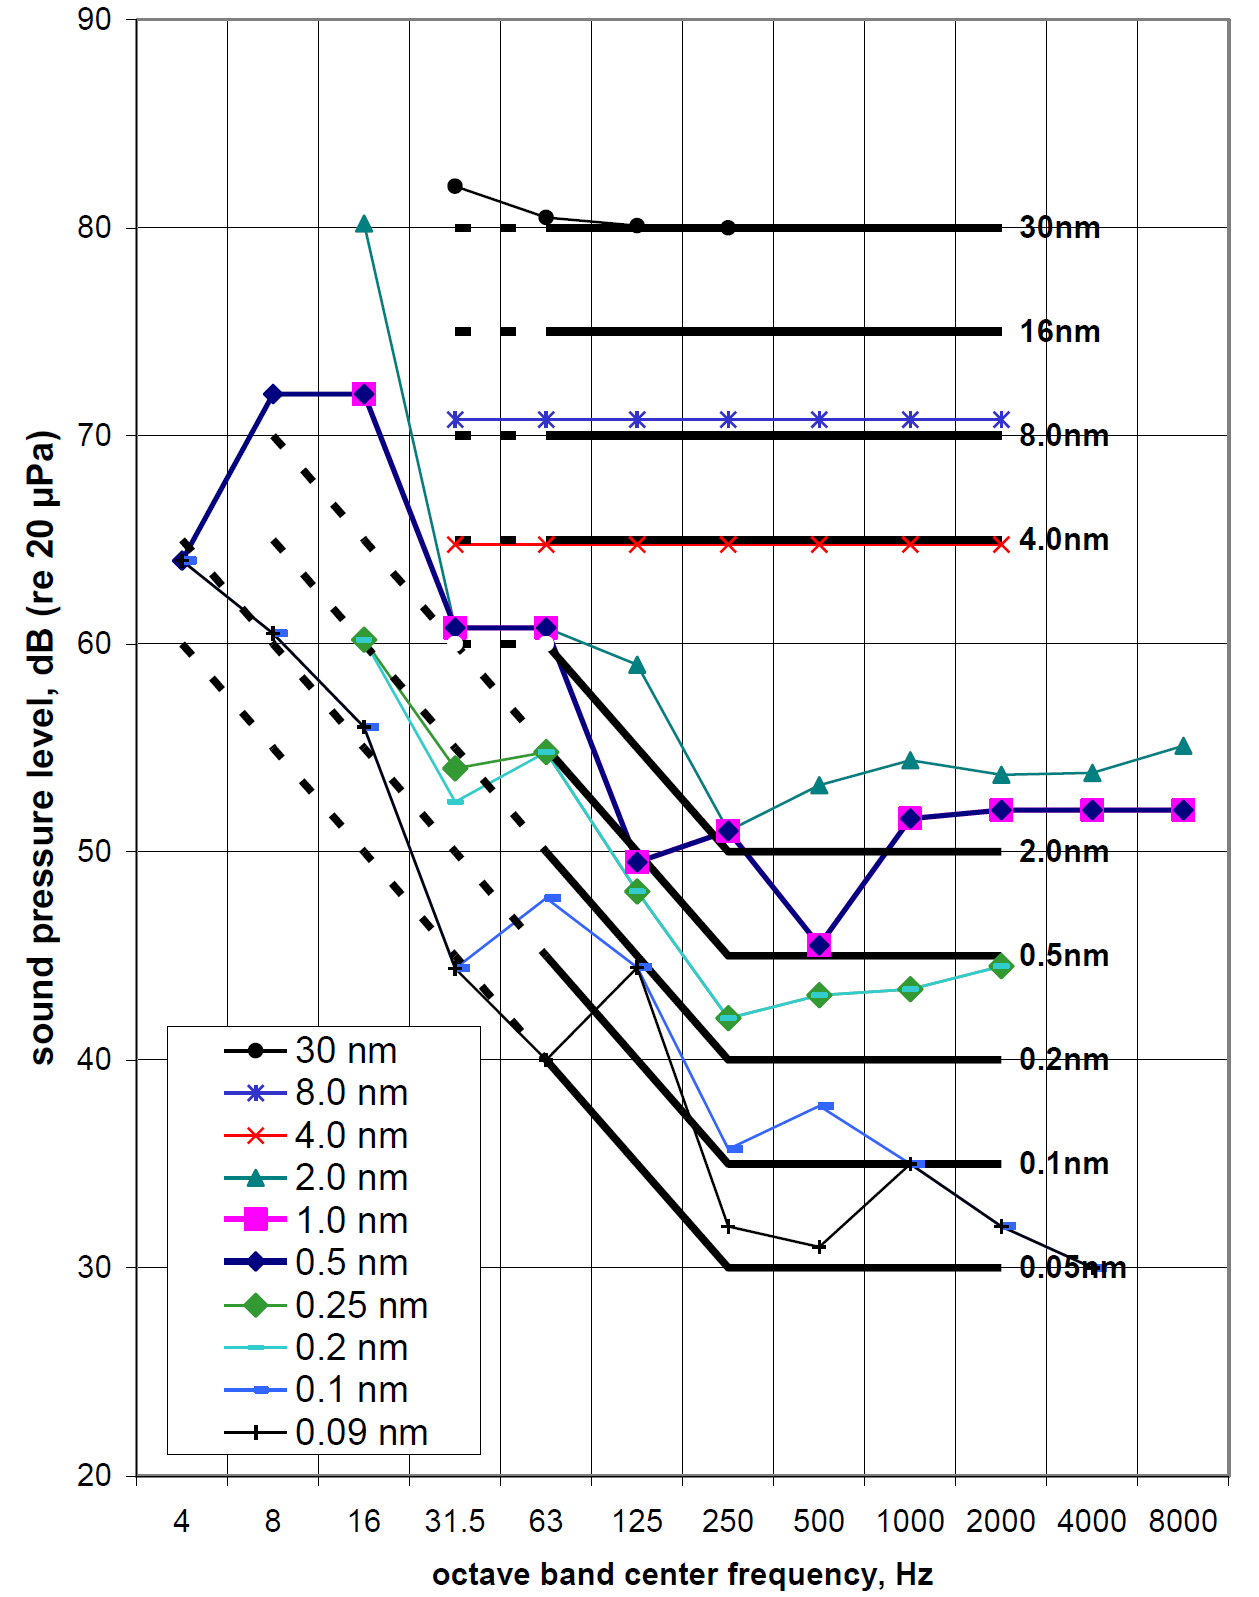
Although there are many types of noise-sensitive tools, including interferometers, atomic force microscopes and other probe devices, this study focuses on SEMs, TEMs, and STEMs (scanning transmission electron microscopes) since for these instruments we found noise sensitivity data for the greatest variety of makes, models, and resolutions. Figures 1 and 2 show all of the data collected for these instruments, of various makes and resolutions, in comparison with the commonly-used NR curves9.
Reviewing the data, it is clear that this collection of frequency spectra do not follow the NR (or NC) curve shape. Instead, especially obvious in the SEM data (Figure 1), there is a range of constant sound pressure, from about 250 Hz up (around 50 dB, with one exception). Perhaps this should not be surprising, given that the related vibration criterion (VC) curves fall out as lines of constant velocity above a certain frequency, and the function that relates radiated sound pressure to vibration in a panel is proportional to velocity.
Also, one wonders if the criteria for the few tools that represent a constant (or, in one case of one TEM, downward-sloping) amplitude sensitivity above 1000 Hz are realistic. Most of the tools become less sensitive above 500 or 1000 Hz, and this is consistent with our understanding of the likelihood of noise-induced vibration in machinery at high frequencies.6
TOOL SENSITIVITY VERSUS RESOLUTION AND MAGNIFICATION
Experience and intuition imply that a tool’s operating resolution or magnification is a function of the tool’s sensitivity to various environmental factors. But it also depends on other factors, such as the design of the tool structure, and the presence of engineering details to reduce sensitivity (such as enclosures)10. Thus, while we may expect a general trend in sensitivity to noise versus resolution, we will expect some spread in the data.
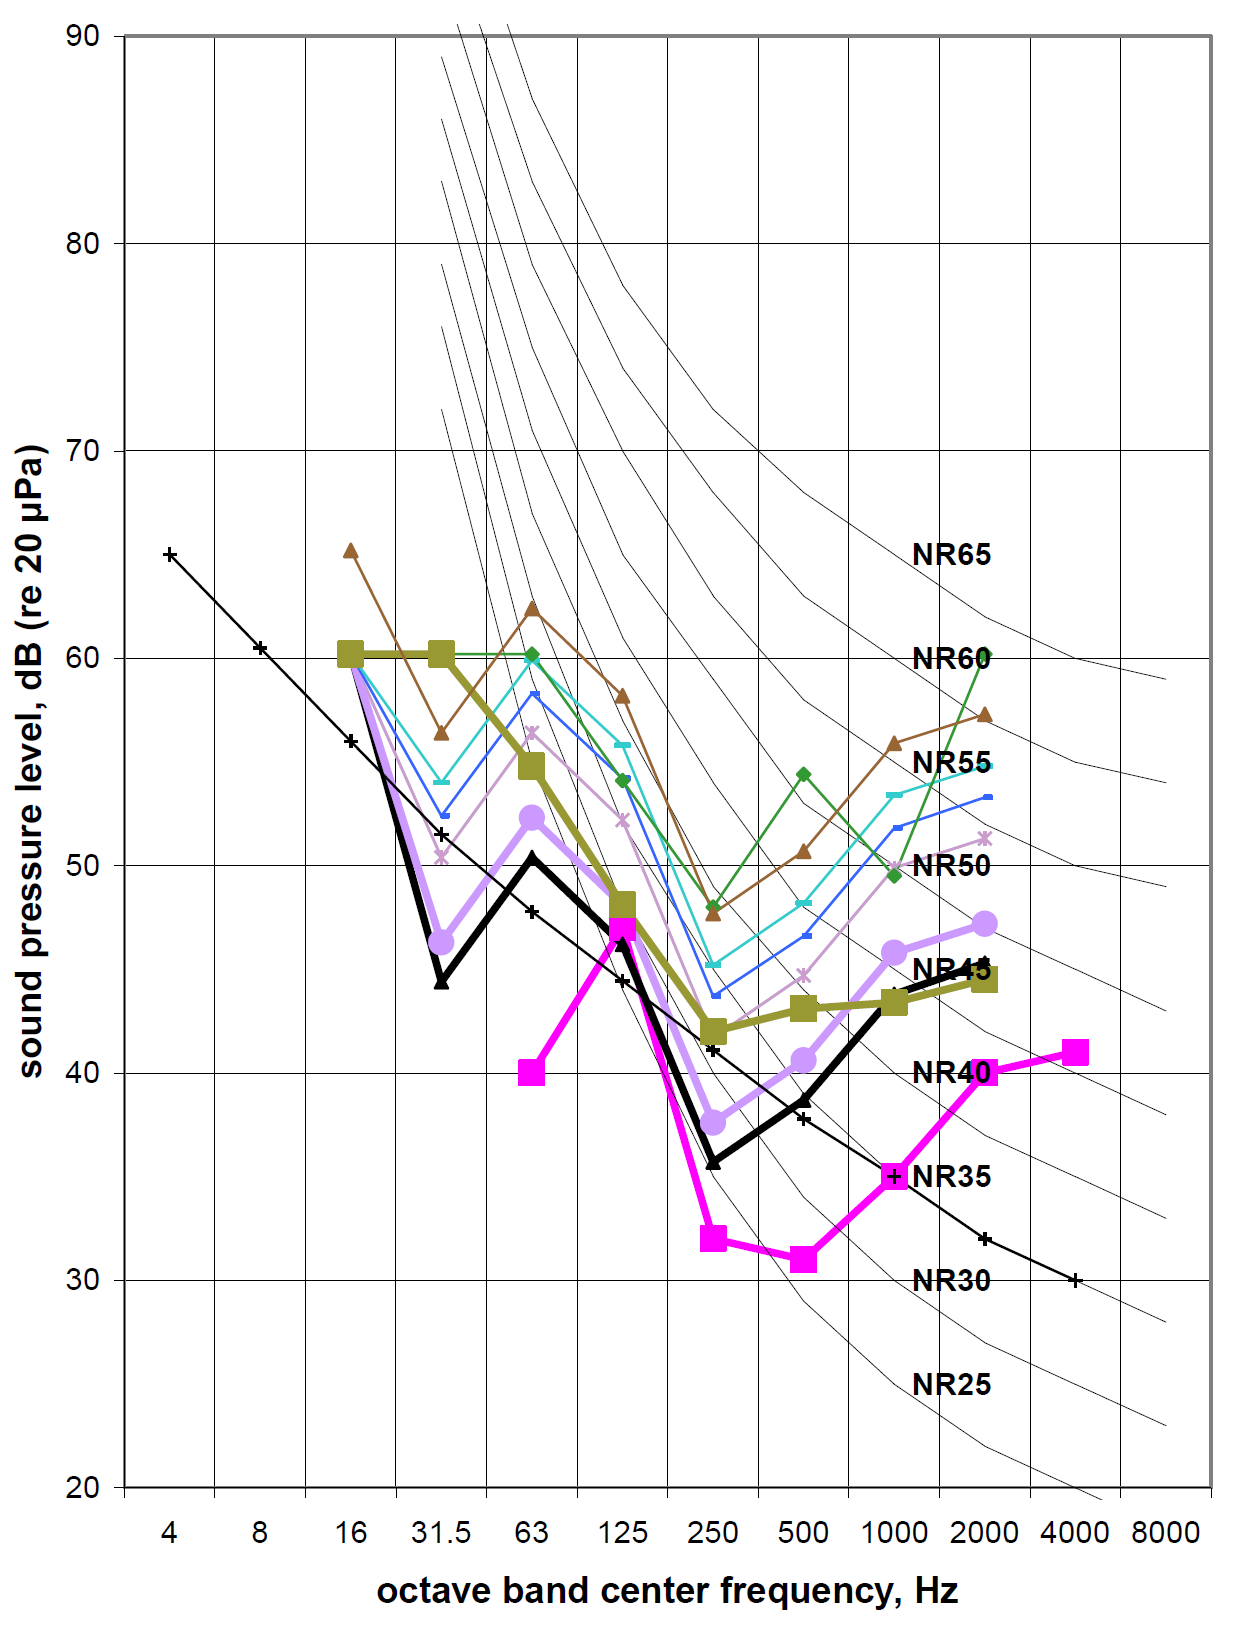
To examine this relationship, it is necessary to reduce each of the noise spectra to a single value for comparison with the corresponding single value for resolution or magnification. Several means were tested. These included using the A-weighted overall sound level; the lowest noise level in the octave band and original one-third octave band spectrum (MINOB or MINOB/3); and the “inverse summed” value for all of the octave bands and original one-third octave bands (ΣOB or ΣOB/3), i.e.,

where x1, x2, x3, etc., are the various octave band or one-third octave band amplitudes. The best fit linear regressions between noise sensitivity and resolution, determined by the correlation coefficient squared value (R2), were found using the ΣOB/3 or MINOB/3 value.
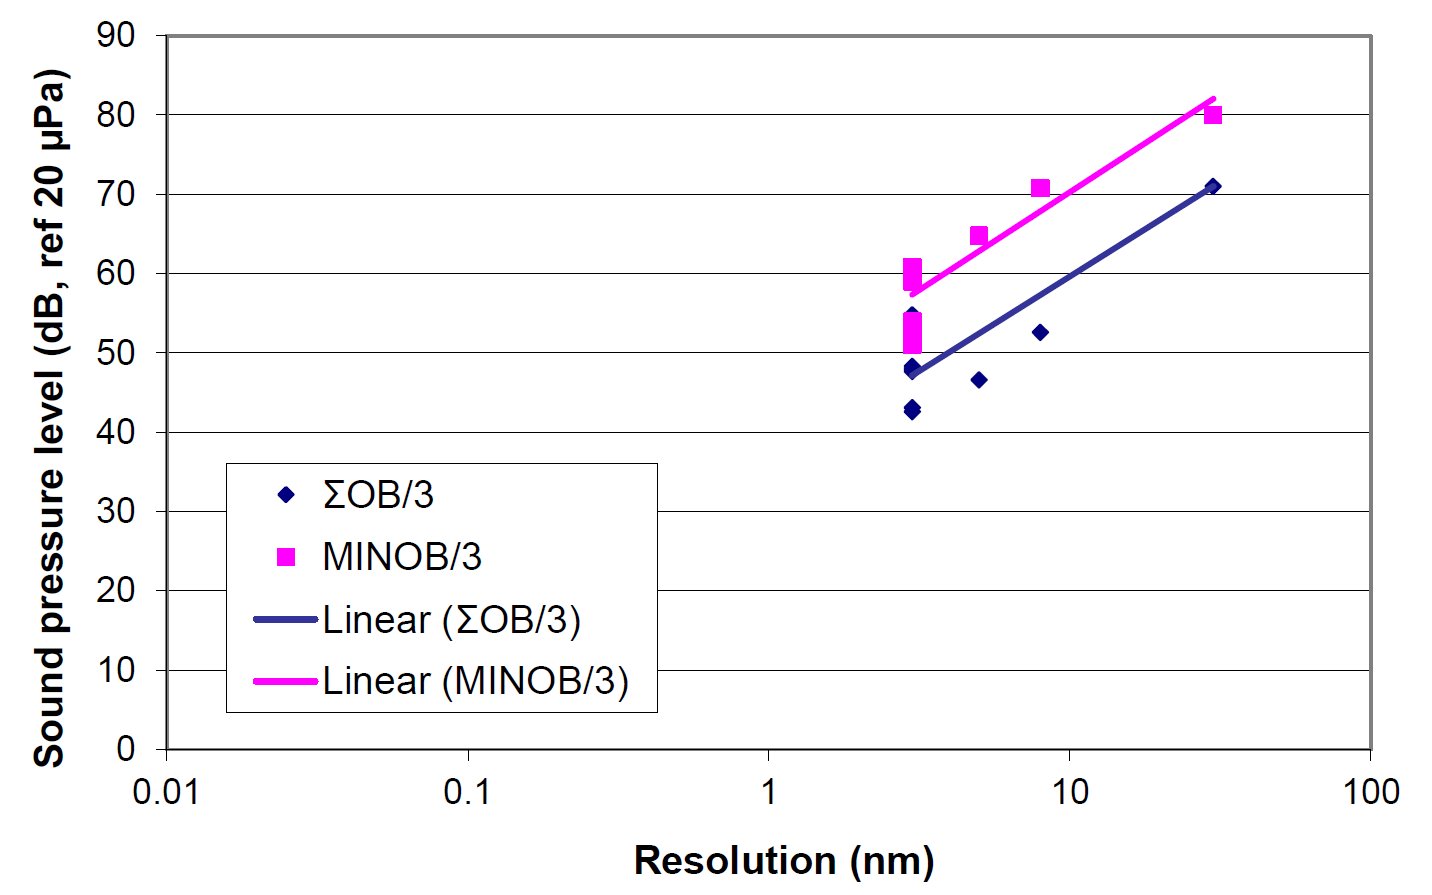
For example, Figure 3 plots the maximum rated resolution of several SEMs versus noise sensitivity. The trend shows a general correlation, but not good correlation. The fit to the data from SEMs of one manufacturer is much better, as shown in Figure 4. Perhaps this is to be expected, as these SEMs probably have been designed using similar internal structural design concepts.
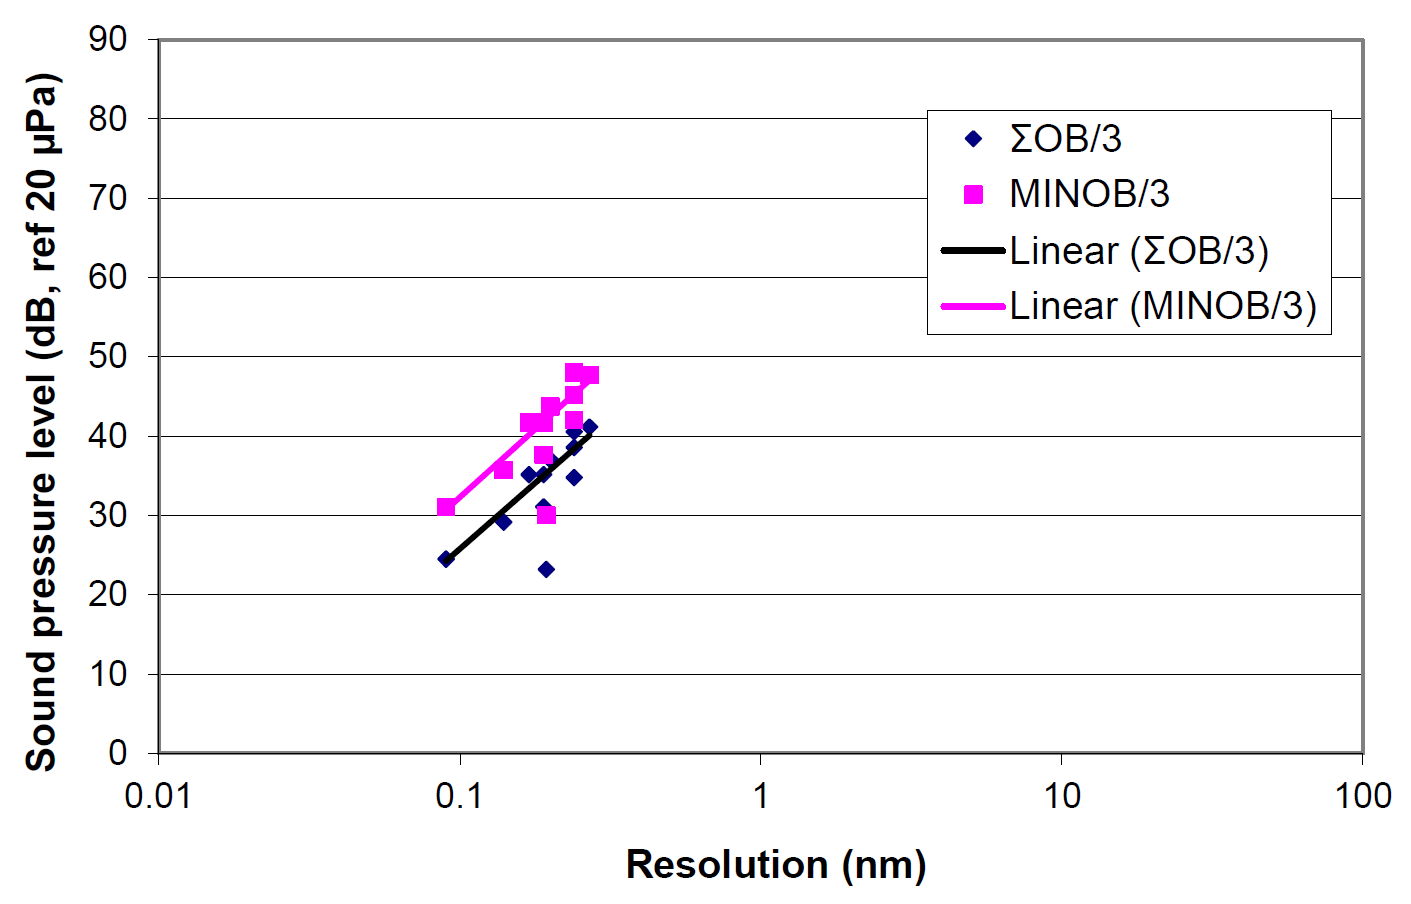
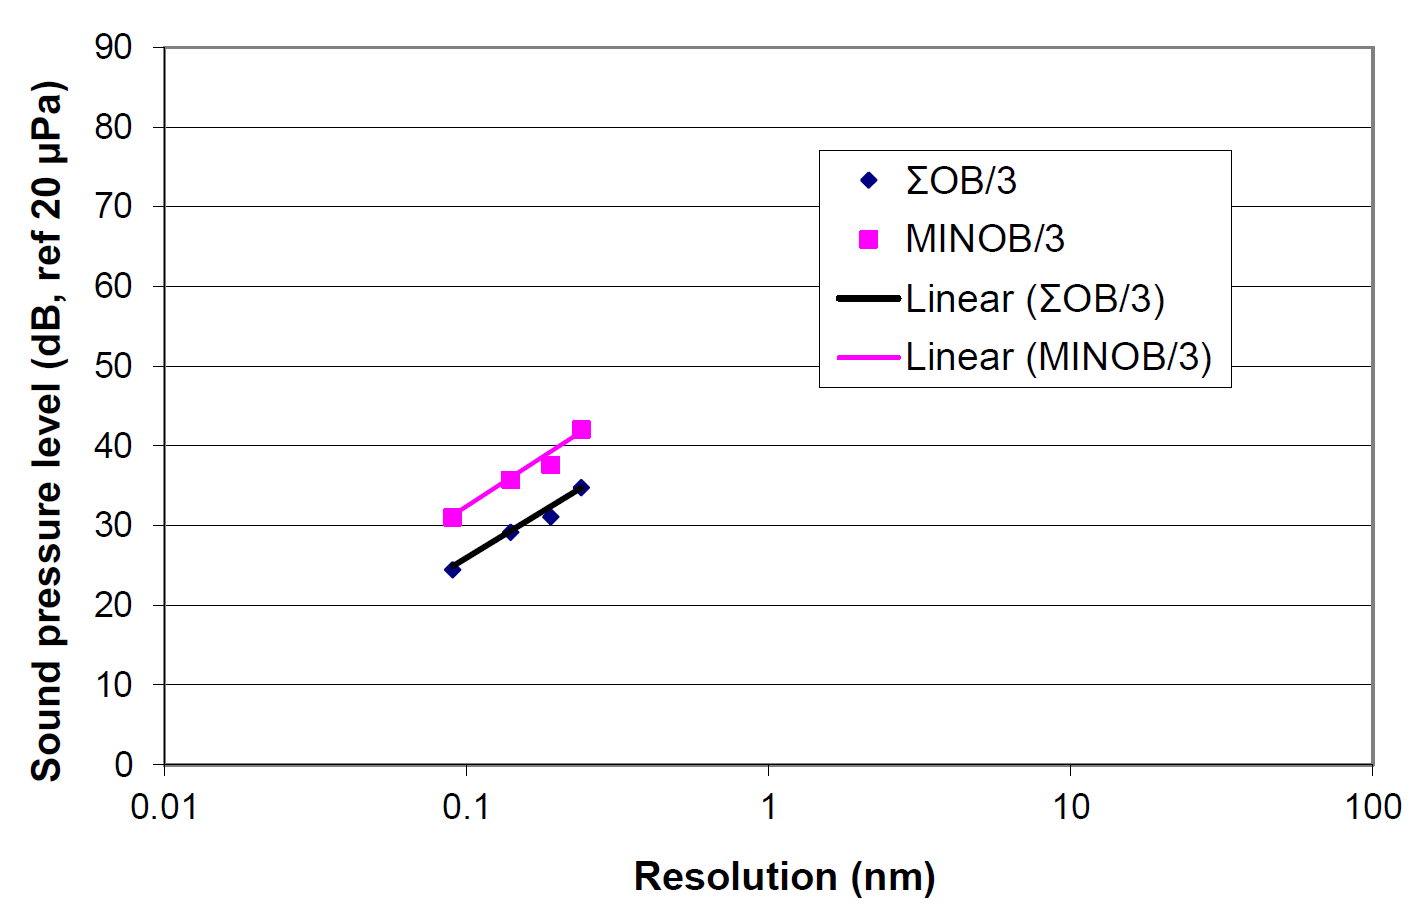
Similar plots for various TEMs and STEMs are shown in Figures 5 and 6. In these cases, the populations are much more limited, but there is better correlation, at least in part because fewer manufacturers are represented.
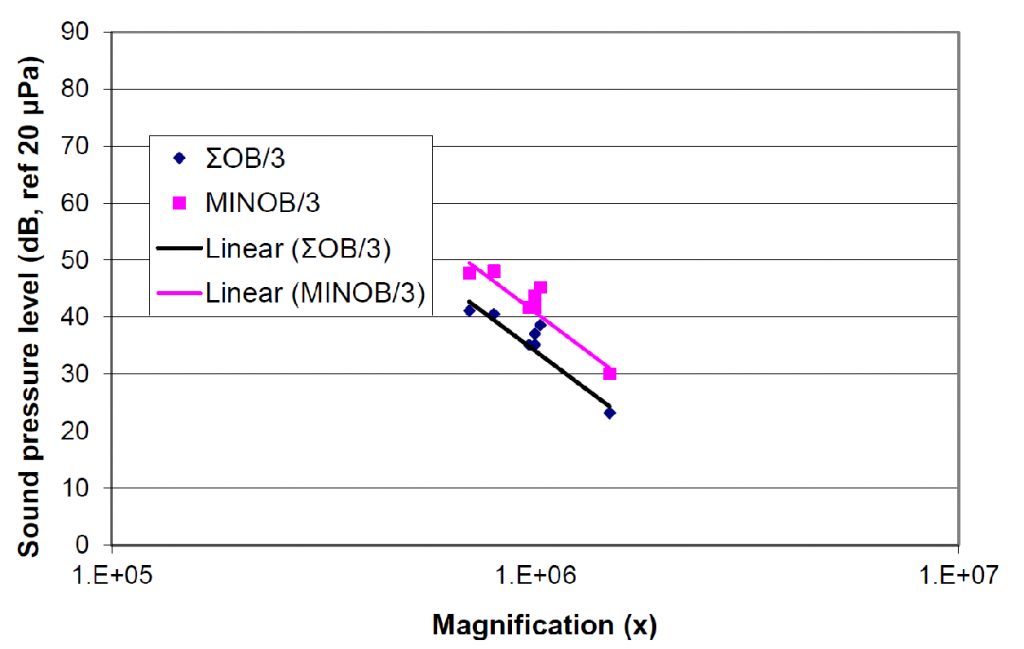
The manufacturer’s data for the TEMs examined also typically contained maximum magnification specifications, and Figure 7 compares these with the representative noise levels. There is very good correlation between noise and maximum magnification.
GENERIC NOISE CRITERION CURVES FOR TOOLS
The lower bound of the data shown in Figures 1 and 2 describe potential shapes for generic noise criterion curves for tools, and the data in Figures 3 through 6 imply that a family of curves might be identified, as a function of achievable resolution.
Figure 8 summarizes all of the data in Figures 1 and 2 taking the lower boundary of the data for various resolutions. The divisions between selected resolutions are arbitrary, defined where there appeared to be a significant separation in the amplitude of the data points. The resolutions of the SEMs for which we have data varies between 0.5 and 30nm, and the STEMs and TEMs vary from 0.09 to 0.024 and 0.027nm, respectively.
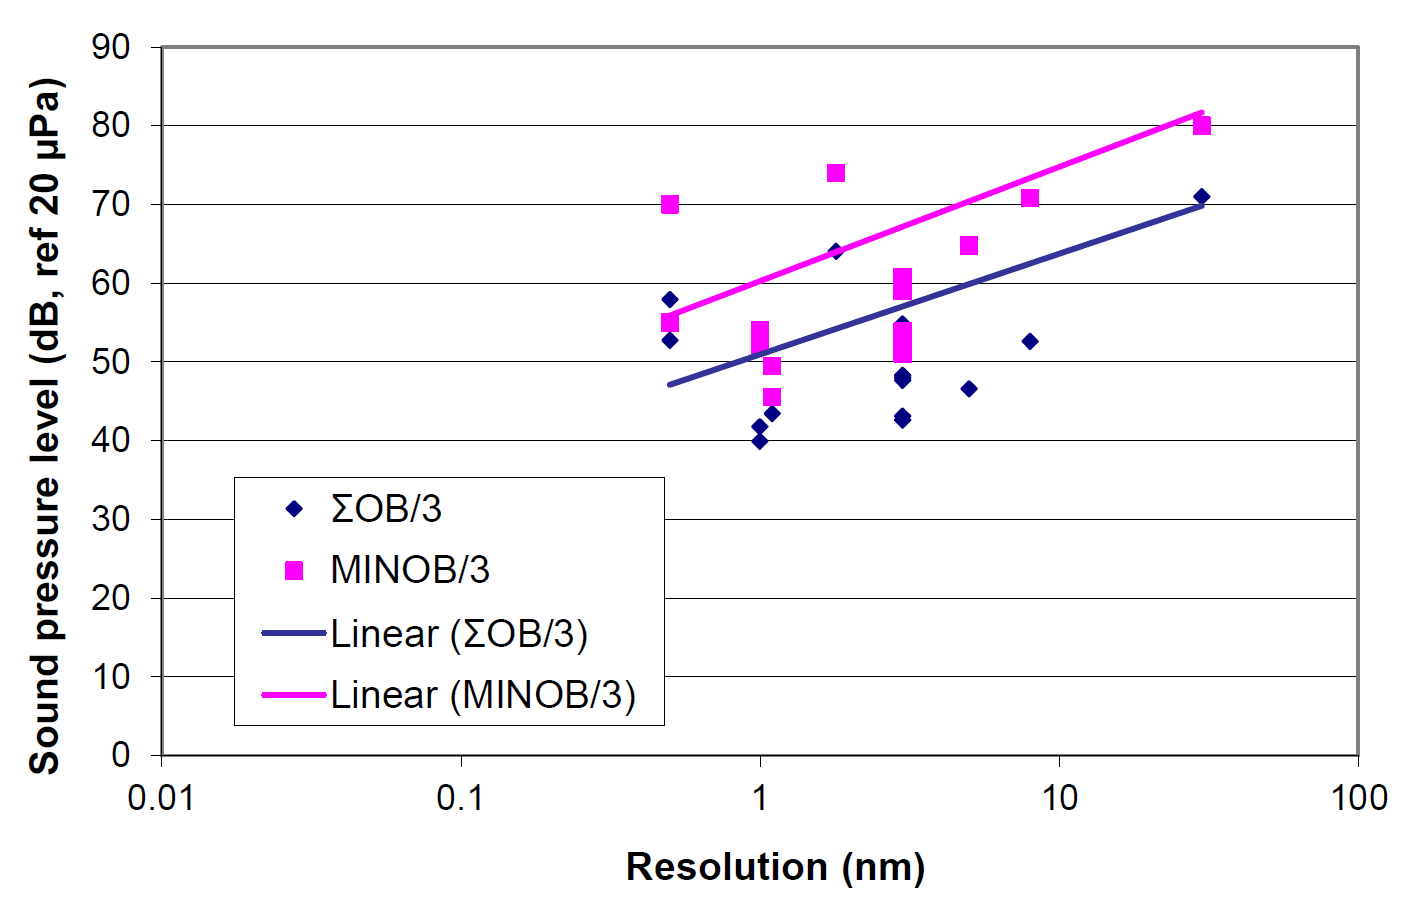
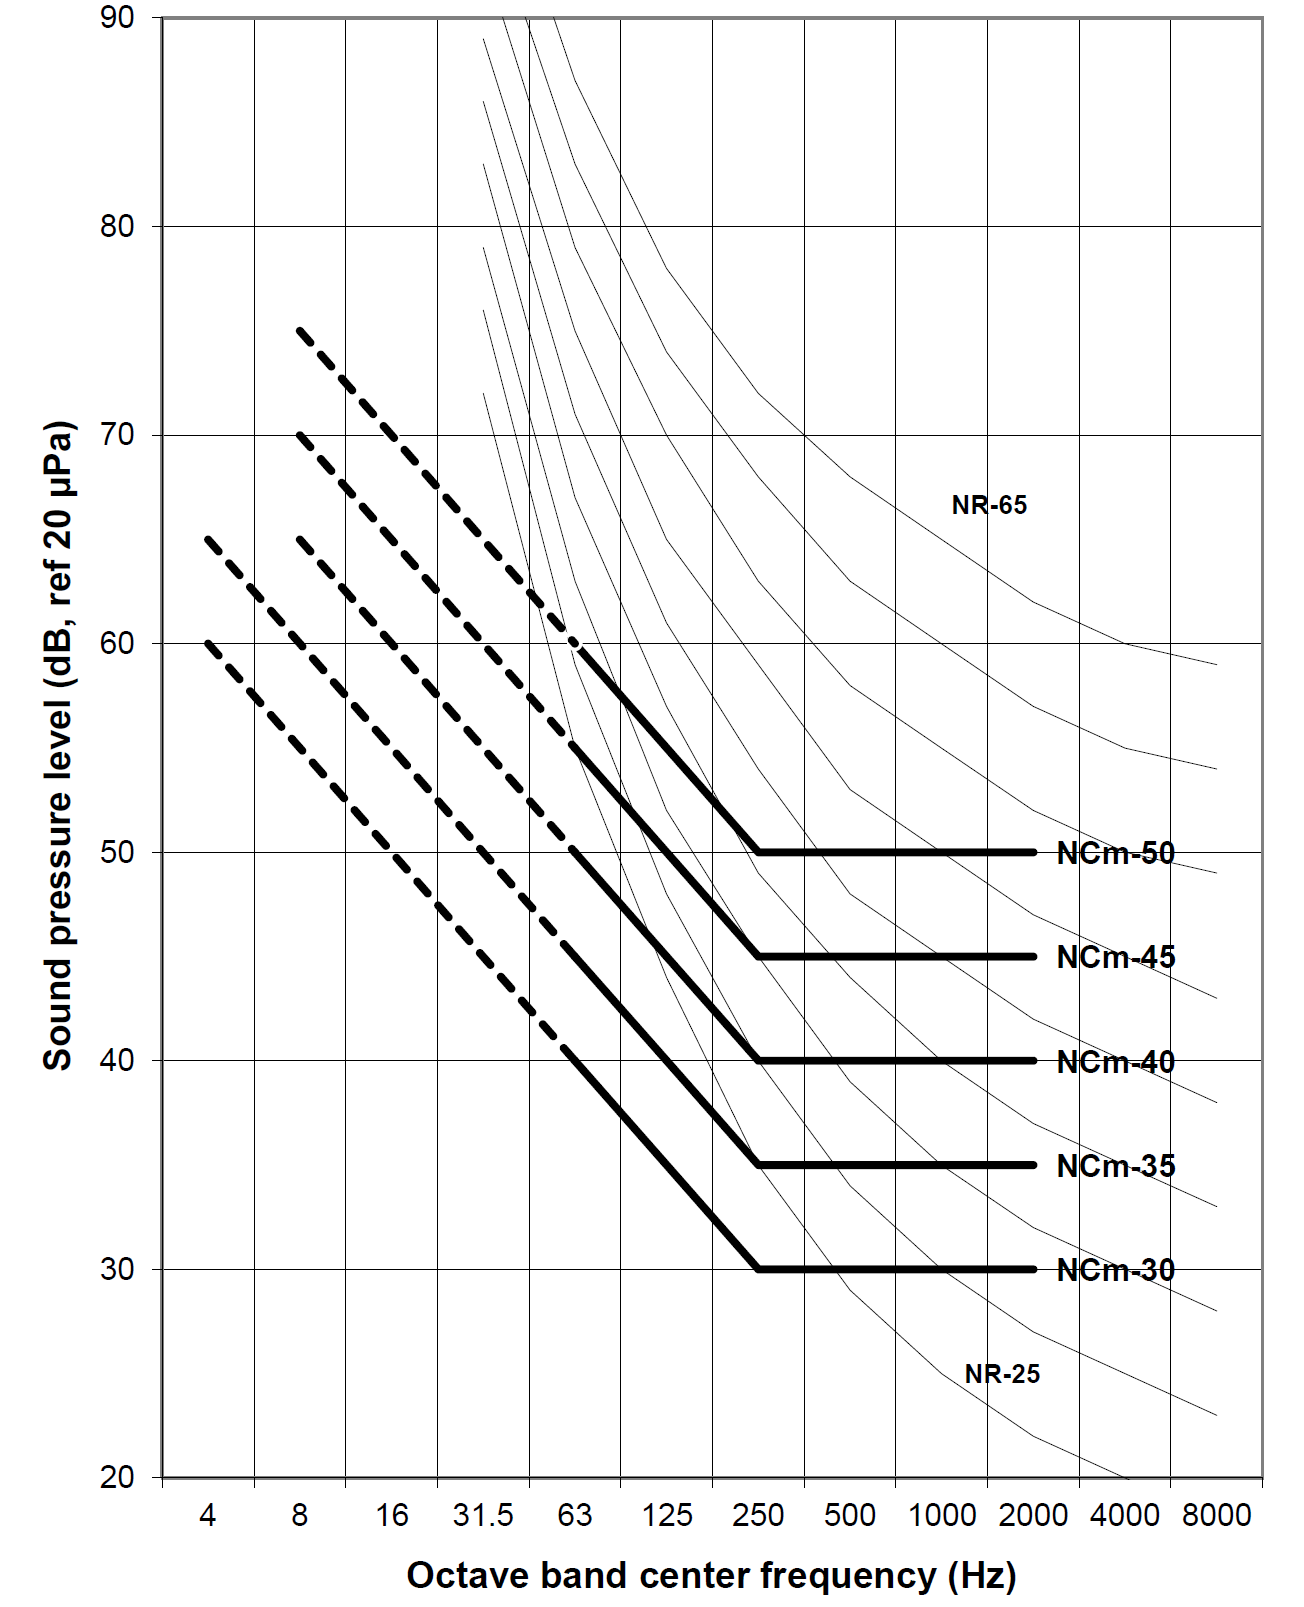
To conclude this exercise, Figures 8 and 9 overlay generic curves suggested by these data, as a function of achievable resolution. The curves are shown in solid in the 63 to 2000 Hz range and dashed in the infrasonic range below 63 Hz. This is to emphasize that design of spaces to support tools sensitive in the infrasonic range will be difficult due to the general lack of acoustical design data for the lower frequencies, as discussed above. These requirements should be taken no less seriously, however. In Figure 9, we show only the curves for the equipment of highest sensitivity, which also fall at or below criteria that would typically be used to design a laboratory for human occupation (The NR curves are also shown for example). This is because we would expect the human occupancy curve to set upper limits (i.e., more stringent requirements) for noise at certain frequencies, when low-resolution tools are used. Table 1 tabulates the generic NCT curve values shown.
The recommended curves subtend all but a few outlying data points. Thus, they are generally conservative since they represent the most sensitive tools known for the resolutions given. In any case, when possible, reference to actual tested tool noise requirements is recommended (especially in the case of infrasonic requirements), when these are available.
CONCLUSIONS
High-resolution instruments such as SEMs and TEMs are sensitive to acoustic noise to varying degrees. Although there are other factors, there is a general relationship between achievable resolution and the environmental noise level. The general practice in lab design, when the specific requirements of the tools are unknown, as is often the case, is to use standardized perception-based criteria developed for human occupancy, such as the family of NC or NR curves. However, it has been shown that the frequency response of tools, in general, does not follow the shape of these curves in certain respects. The implication is that the use of NR or NC curves in laboratory design might provide inadequate noise control at low frequencies (<500 Hz) and excessive noise control at higher frequencies, in consideration of the tools only (for laboratories also containing human occupants consideration of the relatively stringent requirements of the NC or NR curves for higher frequencies is also recommended).
Based on compiled noise sensitivity and resolution data for a significant quantity of various types of electron microscopes, generic tool noise criterion curves have been developed for use in the design of laboratories in cases where the specific future tool requirements are unknown, or where there is a desire to provide flexibility in the design to support a number of potential tools.
REFERENCES AND NOTES
- J. S. Bendat and A. G. Piersol, Random Data: Analysis and Measurement Procedures, John Wiley and Sons, New York, (1989).
- Such methods still do not attempt to account for the most extreme cases, exceptions where, for example, the work of the tool has not been well defined, or the structure of the tool does not meet contemporary design standards.
- These were first referenced in E. E. Ungar and C. G. Gordon, “Vibration Challenges in Microelectronics Manufacturing”, Shock and Vibration Bulletin, 53(I):51-58 (1983), but many subsequent references provide more recent and developed definition, such as by the Institute of Environmental Sciences (IEST), “Considerations in Clean Room Design”, Institute of Environmental Sciences, IES-RP-CC012.2 (2005); and H. Amick, M. L. Gendreau, T. Busch, and C. G. Gordon, “Evolving Criteria for Research Facilities: Vibration”, Proceedings of SPIE Conference 5933: Buildings for Nanoscale Research and Beyond (2005). To the author’s knowledge the VC curves are of the most commonly used for such purposes, but there are other families of vibration criterion curves (some of which simply give the same curves another name). One of the original authors of the VC curves gives a summary of some of the other generic criteria in C. G. Gordon, “Generic Vibration Criteria for Vibration-Sensitive Equipment”, Proceedings of SPIE Vol. 3786 (1999).
- As discussed elsewhere, for example in M. L. Gendreau and H. Amick, “Micro-Vibration and Noise Design”, Chap. 39 in Semiconductor Manufacturing Handbook, edited by Hwaiyu Geng, McGraw-Hill, New York, (2005), the frequency response sensitivity curves for equipment tend to be complex, with frequencies of maximum sensitivity corresponding to internal structural resonances.
- Historically, more stringent curves were occasionally added to the VC family with advancing generations of tools operating at progressively higher resolutions. Because of physical limitations, requiring increasingly better building performance gradually becomes more technically impractical and cost prohibitive. For design purposes, it may be the case that, with some building types and locations, the limit in rigid building performance is reached, and that it would now incumbent upon the tool manufacturers to make their instruments less-sensitive to environmental vibration, to the extent that this is possible, with increasing sensitivity. This is discussed in further detail in H. Amick, A. Chasey, M. L. Gendreau, “Tool or Facility – What Should it Be?—Reconciling differences between production equipment needs and facility support”, Proc. 1st ISMI Symposium on Manufacturing Effectiveness (2004). Practical performance limits may also be identified for acoustic noise, as discussed in the present essay.
- M. L. Gendreau, “The effect of varying acoustic pressure on vibration isolation platforms supported on air springs,” Proceedings of the 16th International Congress on Sound and Vibration (ICSV16), Kraców, Poland (5 to 9 July 2009).
- M. L. Gendreau, “(Specification of the) Effects of Acoustic Noise on Optical Equipment”, Proceedings of SPIE Vol. 3786 (1999), reprinted and updated in Noise & Vibration Worldwide 32(4), 17-22, (2001).
- C. G. Gordon and T. L. Dresner, “Methods of Developing Vibration and Acoustic Noise Specifications for Microelectronics Process Tools” Proceedings of SPIE Vol. 2264 (1994)
- With the primary exception that the NR curves extend down to 31.5 Hz (which is useful in the present discussion but impractical for design as discussed herein), they are similar to the NC curves commonly used in the United States and elsewhere. See M. L. Gendreau, “Building Design for Advanced Technology Instruments Sensitive to Acoustical Noise”, Buildings for Advanced Technology, (accessed at publication time at www.nanobuildings.com/bat/presentations/downloads/MGendreau_BuildingDesign.pdf) for a comparison of these and other generic curves.
- For example, in one case examined, three models of the same tool are differentiated only by the sample size handled (and thus, different stage and chamber size). In this case, for the same rated resolution, the tool is stated to be increasingly more sensitive to noise with increasing ability to handle larger sample sizes.
M. Gendreau, “Generic Noise Criterion Curves for Sensitive Equipment,” Invited Presentation, Proceedings of Acoustics 08 Paris, Paris, France (29 June to 4 July 2008)
c5e07b5e3ae741335b31532104fe7aed