ABSTRACT
The paper presents a review of generic vibration criteria used for vibration-sensitive technical facilities. The paper reviews the logic behind and evolution of the Vibration Criterion (VC) curves, originally known as the “BBN” criteria, and discusses the background of a generic criterion in common usage for nanotechnology, currently denoted NIST-A. The criteria are compared with representative types of research equipment and activities.
1. INTRODUCTION
The vibration sensitivity of certain groups of equipment used in research and advanced technology manufacturing has been recognized for some time. Various equipment manufacturers have provided requirements or recommendations for vibration environments (of varying degrees of quality) for many years.
When designing vibration-sensitive facilities for advanced technology or R&D, it is customary to use so-called “generic” vibration criteria. Rather than designing a facility to meet the requirements of a single piece of equipment, present and future flexibility can be enhanced if the facility is designed to meet the requirements of a group of equipment which might be used for the work to be carried out there.
Several generic vibration criteria have been in use since the early 1980s, particularly by the microelectronics and optoelectronics industries and research communities. The introduction of pneumatic isolation and the requirements of metrology and nanotechnology have led to modification of those criteria and the introduction of new ones. We shall review the development and evolution of criteria, comparing them with representative types of research equipment and activities.
Two families of generic criteria will be discussed:
- the VC criteria developed in the early 1980s by Eric Ungar and Colin Gordon1,2, originally known as the “BBN” criteria, and subsequently promulgated by the Institute of Environmental Sciences and Technology (IEST)3; and
- the NIST-A criterion developed in the early 1990s for the Advanced Measurement Laboratory at the U.S. National Institute of Standards and Technology (NIST)4.
The VC criteria were originally developed for use in the semiconductor industry, but have found application in a wide variety of technological applications. The NIST-A criterion was developed for metrology, but has gained popularity within the nanotechnology community.5
2. EQUIPMENT-SPECIFIC VIBRATION CRITERIA
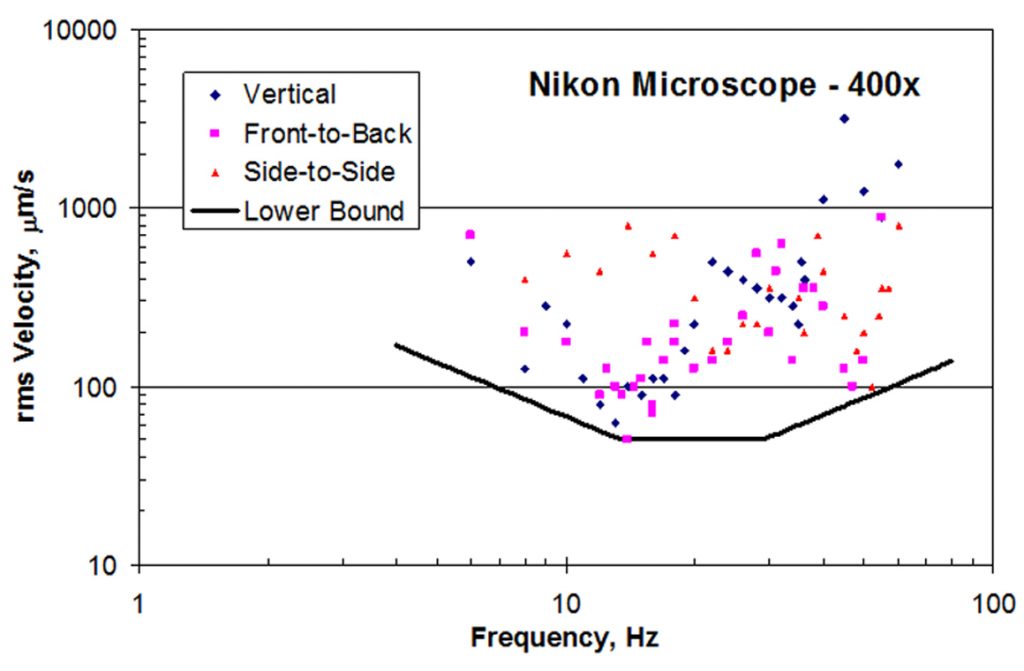
Most manufacturers provide vibration requirements for their equipment, though these criteria are not of uniform quality. (Most of them are proprietary in some way, as well.) As an example of how the vibration sensitivity might be determined for a typical piece of equipment, we may examine the study of microscope sensitivity reported by Amick and Stead,6 making use of data from an earlier study by Amick and Bui.7
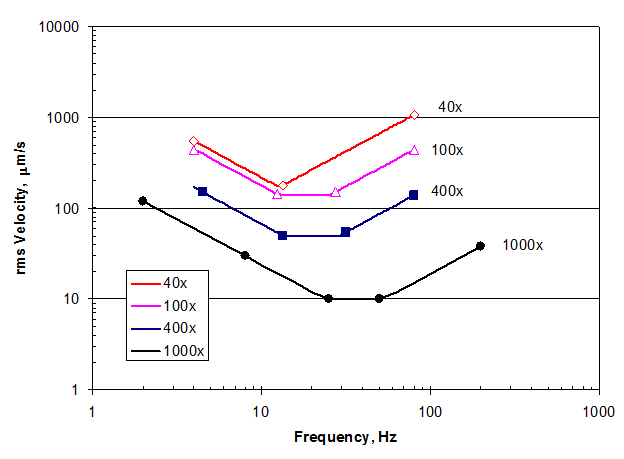
The microscope used in this study was a new Nikon Eclipse Model E400 configured to provide magnifications of 40x, 100x and 400x. It is representative of binocular benchtop microscopes used in laboratories for a variety of functions. The earlier study by Amick and Bui7 used a similar microscope of an earlier generation, the Nikon Optiphot 66, configured at 1000x. The latter was common in semiconductor inspection applications.
The objective of both studies was to define the “threshold of perception” for the microscope as a function of magnification, rather than simply document the amplitude at which there was onset of interference with a particular task. The perception threshold was thought to be process-independent, allowing its application to a wider variety of research or inspection functions. To this end, a “neutral” object was used for observation—a graduated calibration standard, with etched lines of varying widths between 1 and 10 μm.
The study led to definition of perception thresholds at a collection of frequencies, shown in Figure 1 for 400x. The vibration sensitivity is clearly frequency dependent, and is less sensitive at low frequencies and high frequencies, with its greatest sensitivity being at frequencies between 10 and 30 Hz. (This particular microscope was shown to have several resonances in this range.) A lower bound to the threshold points is shown. (Each line segment represents, from left to right, constant acceleration, velocity, and displacement.) When the data from all four magnifications are combined using the respective lower bound threshold curves, as in Figure 2, we see that vibration sensitivity of this kind of microscope is magnification-sensitive.
3. IEST VC VIBRATION CRITERIA
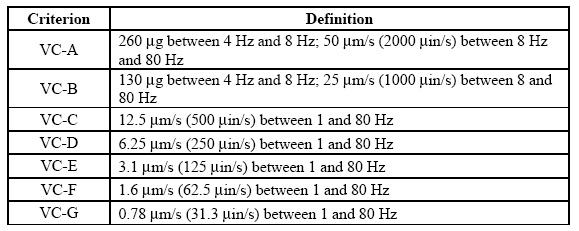
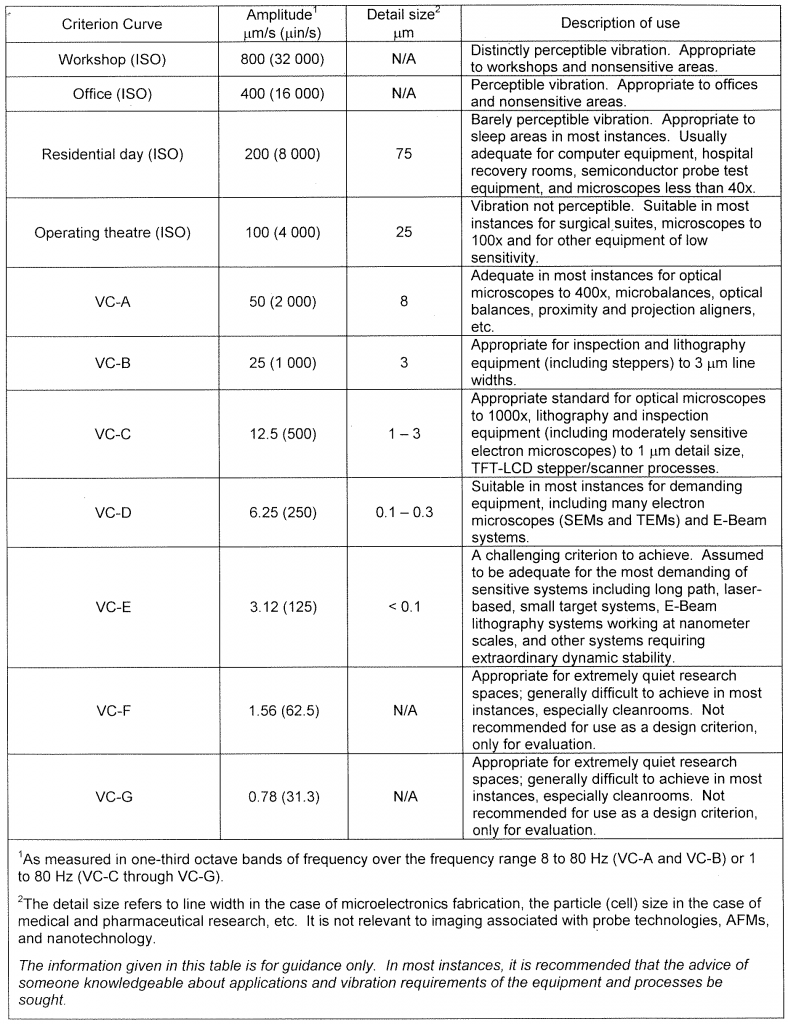
The VC criteria take the form of a set of one-third octave band velocity spectra labeled vibration criterion curves VC-A through VC-G, illustrated in Figure 3 and numerically defined in Table 1. The settings to which the criteria are applicable are defined in Table 2. The original set of curves (A through D) were developed by Gordon and Ungar1,2, and have been modified several times during the intervening years.8
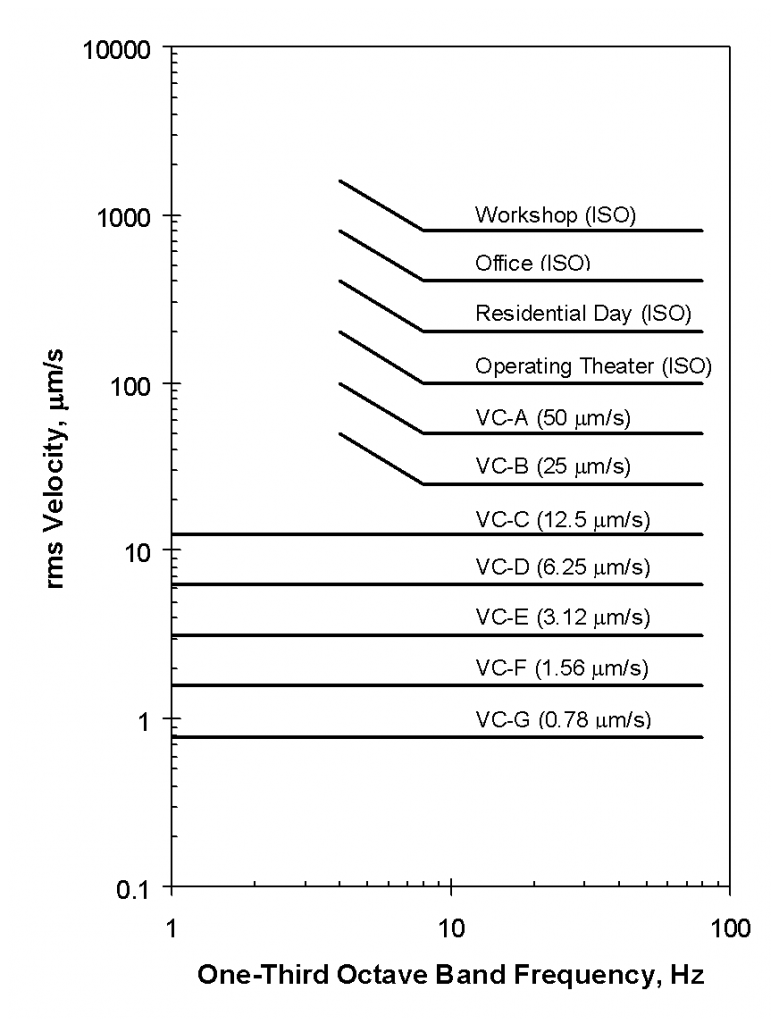
The intent of the criteria was to present lower bounds of the published vibration criteria for specific processes and families of equipment (such as the microscope at 400x shown in Figure 1). Thus, the generic criteria are inherently conservative, but applicable to a collection of equipment with a single objective, rather than a single device.
The two most significant modifications were the inclusion of additional curves and the “flattening” of some of the curves. VC-E was an early addition, and has seen increasing use in the semiconductor industry since the late 1980s. VC-F and -G are new, and were added in response to requests from scientists who wished to characterize their very quiet spaces, but without having to define it as some fraction of VC-E. Curves F and G are not intended for use as design targets, particularly in the semiconductor industry.
The change in the curve shape is the result of a suggestion in 1990 by Ungar, et al.,9 which has been followed in practice (when applicable) since that time, though the curves were not modified in a published version until 2002.5 The intent of the revised shape was to account for the increased sensitivity at low frequencies (generally between 1 and 4 Hz) that is due to the pneumatic springs used in many items of equipment. In 1990 a minority of equipment came with internal isolation; now it is included the vast majority.[1]
The curves are currently published in an IEST Recommended Practice, with a number of other reproductions10 or variants11. They are shown in their current form in Figure 3, together with the International Standards Organization (ISO) guidelines for the effects of vibration on people in buildings.12 The criteria apply to vibration as measured in the vertical and two orthogonal horizontal directions, and are applied to each direction separately.
Measured vibrations are to be processed in one-third octave bands of frequency, a form in which the bandwidth is proportional to frequency, and the “center frequencies” of individual bands are standardized. The bandwidth is 23 percent of the center frequency. The amplitude units are root-mean-square (rms) velocity (as opposed to zero-to-peak or peak-to-peak).13
Vibration environments may be relatively steady or vary with time. In the latter case, they may vary slowly over a long period (such as night vs. day) or more rapidly (such as with the passage of a train). All of these conditions can be processed in one-third octave bands and compared with the criteria, but the averaging method can vary.
For environments that are continuous and steady-state in time, the criteria apply to the “linear average” of data samples acquired over an adequate time period. In instances where the environment is impacted by occasional disturbances such as vehicular movements, “stage” movements (in tools), passing trains, etc., these may be evaluated in the “peak hold” or “maximum RMS” or “maximum hold” mode of the measuring system. If the disturbing event is long enough (i.e., “Quasi-static”, or steady-state during the averaging time, such as day vs. night comparisons) the linear average mode should be used. The importance attributed to these occasional events will depend upon the frequency of occurrence and other parameters relating to the vibration-sensitive process.
Descriptions of the use of these criteria as applied to people and categories of vibration-sensitive equipment are provided in Table 1. These descriptions do not necessarily apply to experimental systems used in laboratory research. Such systems often have not received the benefits of dynamic modeling and vibration isolation available to the equipment manufacturer, or may be one-of-a-kind.
The main elements of the criteria are summarized as follows:
- The vibration is expressed in terms of its root-mean-square (rms) velocity (as opposed to displacement or acceleration). It has been found in various studies that while different items of equipment (and people) may exhibit maximum sensitivity at different frequencies (corresponding to internal resonances), often these points of maximum sensitivity lie on a curve of constant velocity.13
- The use of a proportional bandwidth as opposed to a fixed bandwidth is justified on the basis of a conservative view of the internal damping of typical equipment components.9 Experience shows that in most environments where adequate layout and isolation of electrical and mechanical equipment has been provided, the vibration is dominated by broadband (random) energy rather than tonal (periodic) energy.
- The fact that some of the criterion curves allow for greater vibration velocity for frequencies below 8 Hz reflects experience that this frequency range, in most instances, lies below the lowest resonance frequency of the equipment components to which these curves apply. Relative motions between the components are, therefore, harder to excite and the sensitivity to vibration is reduced. (Note the behavior of the microscope at low frequencies, shown in Figure 2.) The curves more stringent than VC-C do not relax the requirements at frequencies below 8 Hz, and the curves extend down to 1 Hz. This change was based upon the requirements of equipment with internal pneumatic vibration isolation, which in many cases shifted the frequency of greatest vibration sensitivity from greater than 8 Hz down to the range of 1 to 4 Hz.9
- For a floor or site to comply with a particular equipment category, the measured one-third octave band velocity spectrum must lie below the appropriate criterion curve of Figure 3. It is generally accepted that vibration measurements are accurate and repeatable only within about 1 or 2 decibels (12% or 26%), so an overly strict interpretation of a comparison with the criteria is not encouraged. (For instance, a measured value of 51 μm/s versus one of 49 μm/s, when being compared to a criterion of 50 μm/s, lies within the range of inaccuracy—less than 1 decibel—with respect to the criterion, and it may be argued that both of them meet the criterion, from a measurement accuracy perspective.)
The equipment criterion curves have been developed on the basis of data on individual items of equipment and from data obtained from measurements made in facilities before and after vibration-related problems were solved. The curves are generic in the sense that they are intended to apply to broadly defined classes of equipment and processes. They are intended to apply to the more sensitive equipment within each category that is defined.
The criteria assume that equipment will be supported on benches or pedestals that are rigidly constructed and damped so that amplifications due to resonances are limited to a small value or located at non-critical frequencies. The criteria take into account the fact that certain types of equipment (such as stepper scanners) are supplied by the manufacturer with built-in vibration isolation.
It is important to note that these criteria are for guidance only. The “detail sizes” given in Table 2 appear to represent experience at the time of writing. They reflect the fact that the quality of design and of built-in isolation in most equipment tends to improve as dimensional requirements become more stringent. In some instances the criteria may be overly conservative because of the high quality of built-in isolation.
4. EVALUATING LARGE AREAS
For environments involving large areas, such as an entire cleanroom, a single location is probably not representative of the whole. The ambient vibrations of a large area may be characterized by a spectrum representing the mean plus one standard deviation spectrum, Amean+sig, of a collection of spectra obtained at a statistically significant number of locations randomly distributed throughout the cleanroom or other area of interest. The Amean and Asig spectra are defined for a collection of linear spectra Xi as

(1)

(2)
The statistics are calculated for each frequency. The two spectra are combined in log space to obtain Amean+sig, defined as[2]

(3)
When presenting data in a report, the data for a single direction (e.g., vertical) may be summarized in a plot that shows four spectra: Amin, Amean, Amean+sig, and Amax, as in Figure 4. The reader can then easily see the range of the data, the statistically meaningful representations, and the spectrum used to characterize the space as a whole, Amean+sig. In order to compare the performance of the entire space at two different times, the Amean+sig spectra from each set of measurements may be used.
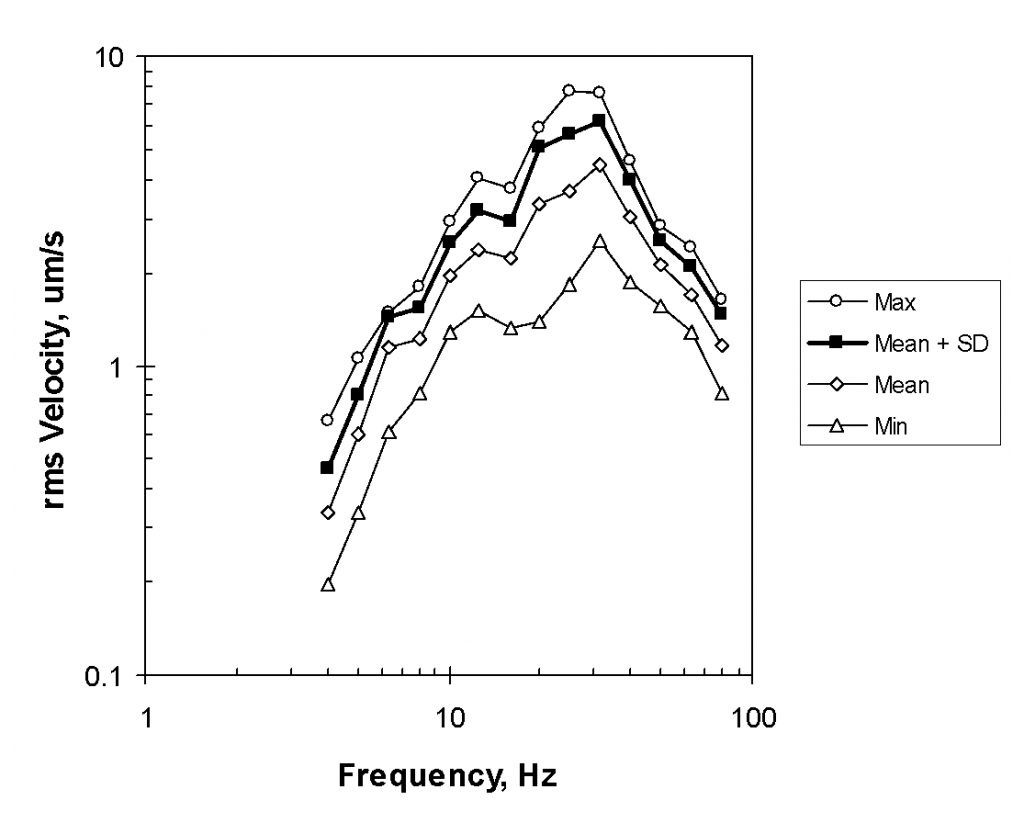
The use of Amean+sig as a means for characterizing a large area infers that the data approximate a Gaussian distribution at each frequency. This is not always the case, because the mechanical “load” (i.e., the dynamic forces traveling into the floor from mechanical equipment, piping, and ducting) may not always be distributed uniformly about the space being evaluated. If it were truly Gaussian, then one could assume that at any location within the area being evaluated, there was an 84% probability that the vibrations at that location would be equal to or less than Amean+sig. Even if the data are not truly Gaussian, it may be argued that Amean+sig provides a more reliable estimate of the majority of the data than either Amax or Amean.
5. THE NIST-A CRITERION AND NANOTECHNOLOGY SPACES
It is difficult to predict where nanoscience is going to head and what it will require with regard to vibration and noise environment. It is probable that equipment for imaging (SEM, TEM, STEM, AFM, etc.) will continue to become more sensitive to both, though the noise requirements of some of the most sensitive instruments are already at the edge of what is practical using today’s technologies. One can only hope that tool vendors become better at internal vibration and noise isolation, as the more established vendors of photolithography tools have become.
The NIST-A criterion, shown in Figure 5 and defined in Table 3, is identical to VC-E at frequencies above 20 Hz, but maintains a constant rms displacement amplitude at lesser frequencies. This is to accommodate some of the ultra-high-precision metrology, probe, and lithography equipment being used in nanotechnology. This is a very difficult criterion to meet at some sites with significant low-frequency vibration content.
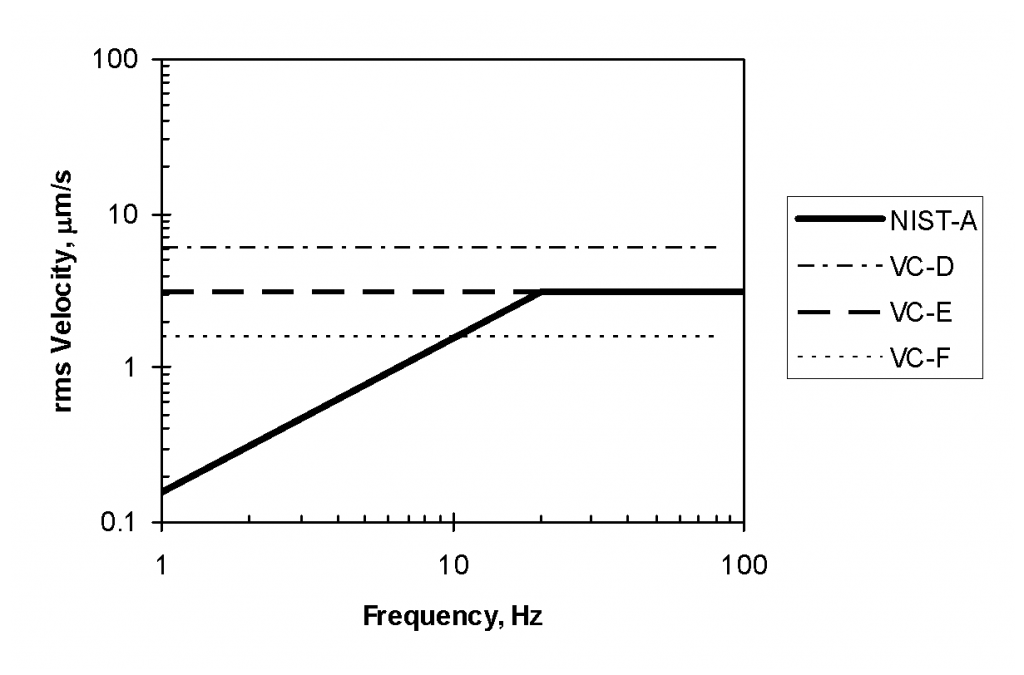
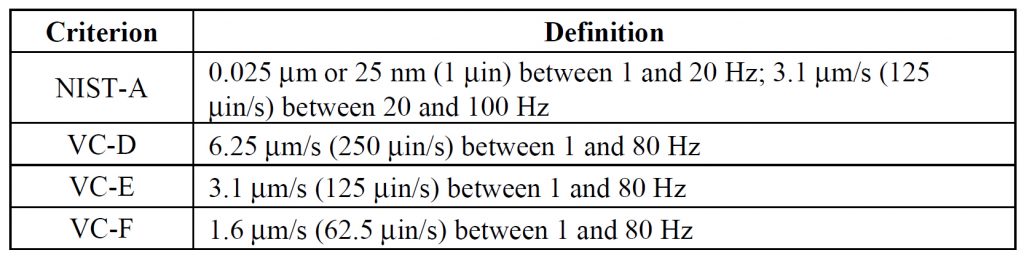
The NIST-A criterion was developed as a criterion for the Advanced Measurement Laboratory (AML) at the National Institute of Standards and Technology (NIST), in Gaithersburg, MD. It represented a compromise between the displacement-sensitive needs of several research areas at NIST (expressed as rms displacement of 1 μin or 25 nm) and VC-E which was, at the time, the cutting edge criterion for many areas of metrology and “off the shelf” instrumentation. The 25 nm criterion is more stringent at frequencies below 20 Hz; VC-E is more stringent at frequencies above this range, where the shaft frequencies of many motors and pumps may be found. (The final performance of the NIST AML is discussed in Ref. 4.)
At the time of this writing, there are several off-the-shelf instruments for nanotechnology research that require an ambient environment comparable to NIST-A.
The reader may also find reference to a “criterion” denoted NIST-A1. This is a bit of a misnomer. There actually was a NIST-A1 criterion for the NIST AML (0.75 μm/s at frequencies between 4 and 100 Hz), but it was more of a philosophy than a set criterion amplitude. It represented the performance achievable with pneumatic isolation in a space meeting NIST-A. It allowed for amplification at frequencies less than 4 Hz (due to the pneumatic isolators).
The NIST AML has a quantity of vibration-isolated spaces, created by placing large concrete blocks on airsprings. If these had been used in a space just meeting NIST-A, then the performance would be on the order of NIST-A1, accounting for degradation at internal resonances. If the space is significantly quieter, then the isolated space will also be quieter. (The metrology areas of the AML were placed deep in the ground, and the vibration performance of the slabs-on-grade is much better than NIST-A.4 The performance of the NIST-A1 systems in the AML has not yet been evaluated.)
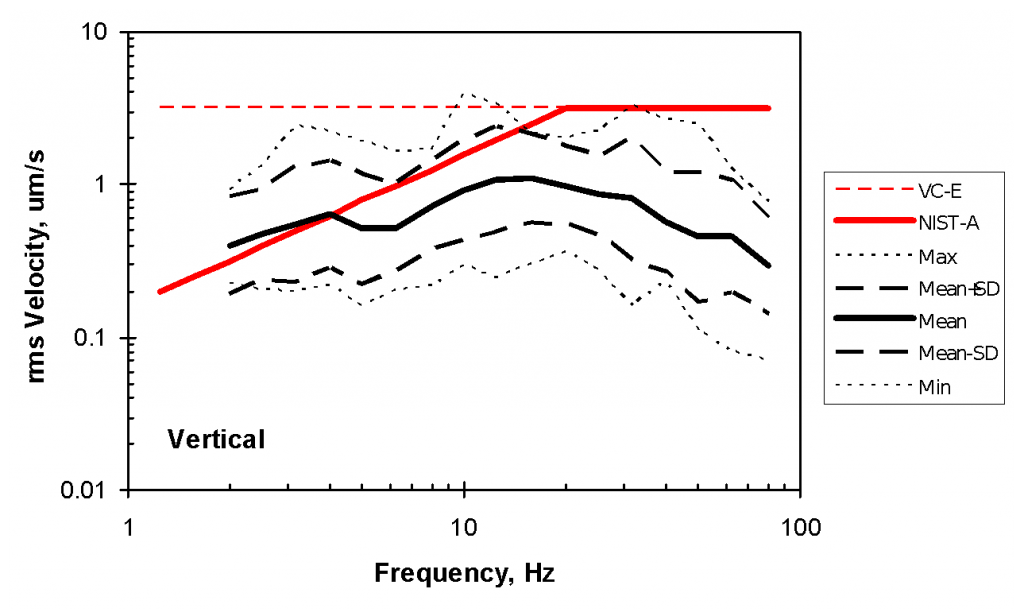
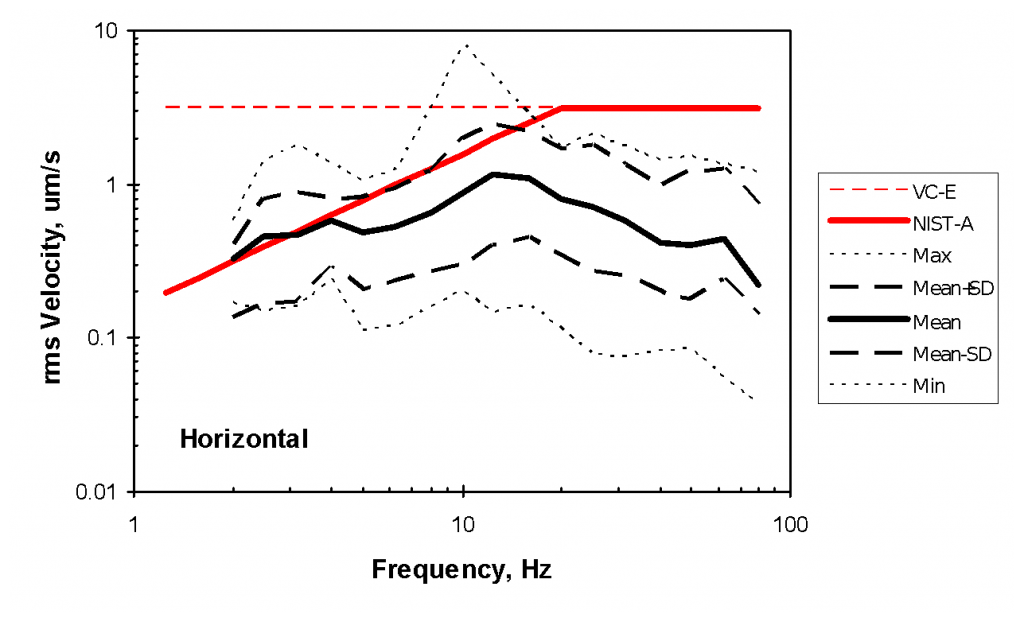
At the time of this writing, ambient site survey data are available for a dozen nanotechnology facilities. (Only one of the facilities has become operational, however.) There is significant variation the performance of those twelve sites, as shown in Figure 6. This set of curves is the result of statistically processing the Mean+SD spectra from each of the 12 sites. Note that not all of the sites met NIST-A (about half did meet it), and that one site exceeded VC-E. Not included are the half-dozen sites that were rejected for having excessive vibrations.
6. FACILITY MATURATION AND TIMING OF A SURVEY
Facility vibrations do not necessarily remain constant over extended periods of time. Vibrations measured during construction may not reflect the contribution of the mechanical systems in their operational state at building completion (commonly called the “as built” state). Likewise, vibrations at a few months beyond completion may include contributions from user-installed equipment, and this contribution could change over time as layout is varied. (This variation has been called “maturation,” and must be considered a normal part of the aging process.14)
It is important that a facility survey be carried out at a time appropriate for characterization of the operational state of interest. For example, one would not want to characterize the “as built” state using measurements made either during construction or at one year after startup.15
7. FLOOR STIFFNESS
Floor vibration alone is not always the sole “vibration” criterion that must be met. Some newer photolithography instruments, called step-and-scan systems (or scanners), increase throughput and resolution (i.e. smaller line widths) by carrying out the critical lithography operation “on the fly” while both reticle and stage are moving. In order to facilitate this, a sophisticated control system generates dynamic positioning forces to coordinate the positions of the reticle and stage. Those forces must be resisted by the structure supporting the tool.
As a result, tool manufacturers specify “resistance” characteristics in addition to ambient vibration requirements. Those resistance characteristics are stated in terms of accelerance (essentially response acceleration divided by a causative force) or mobility (responsive velocity divided by the force) or dynamic stiffness (causative force divided by response displacement). The dynamic measurements involved and the consequences for building designers were explored by Amick and Bayat.16 We are seeing a slowly growing collection of equipment (besides scanners) that impose foundation dynamic stiffness requirements that must be considered in the design of the building.
8. CONCLUSION
The generic vibration criteria originally known as the “BBN Criteria” (now denoted VC curves) were introduced in 1983. Vibration sensitivity of research and semiconductor production equipment has grown increasingly stringent since that time, and generic representation of that sensitivity has had to evolve to keep pace. The advent of ultra-sensitive metrology and electron beam systems used in nanotechnology has forced the introduction of a generic curve (NIST-A) with a much different configuration from the VC curves.
Undoubtedly the evolution will continue. Experience has shown that the environmental requirements for cutting edge research cannot be assumed static. This paper simply serves as a milestone in the evolution of vibration criteria, circa 2005.
In most instances it is recommended that the advice of a vibration consultant be sought in selecting a design standard.
REFERENCES
- Eric E. Ungar and Colin G. Gordon, “Vibration Challenges in Microelectronics Manufacturing,” Shock and Vibration Bulletin, 53(I):51-58 (May 1983)
- Gordon, C. G., and Ungar, E. E., “Vibration Criteria for Microelectronics Manufacturing Equipment,” Proceedings of Inter-Noise 83, pp. 487-490 (July 1983)
- Institute of Environmental Sciences (IEST), Appendix C in Recommended Practice RP-012, “Considerations in Clean Room Design,” IES-RP-CC012.2, Institute of Environmental Sciences, Rolling Meadows, IL, 2005
- Soueid and H. Amick, “Addressing the environmental challenges of the NIST Advanced Measurement Laboratory,” Proc. SPIE Conference 5933: Buildings for Nanoscale Research and Beyond, San Diego, CA, 31 Jul 2005 to 1 Aug 2005
- H. Amick, M. Gendreau, and C. G. Gordon, “Facility Vibration Issues for Nanotechnology Research,” Proc. Symp. on Nano Device Technology 2002, May 2-3, 2002, National Chiao-Tung University, Hsinchu, Taiwan.
- H. Amick and M. Stead, “Vibration Sensitivity of a Laboratory Bench Microscope,” Invited Paper, presented at the First Pan-American/Iberian Meeting on Acoustics; 144th Meeting of the Acoustical Society of America, 2-6 December 2002, Cancun, Mexico
- Amick, H. and S. Bui, “A Review of Several Methods for Processing Vibration Data,” Proc. Intl. Soc. for Opt. Engng. (SPIE), Vol. 1619 (Nov. 1991)
- C.G. Gordon, “Generic Vibration Criteria for Vibration-Sensitive Equipment,” Optomechanical Engineering and Vibration Control, Eddy A. Derby, Colin G. Gordon, Daniel Vukobratovich, Paul R. Yoder, Jr., Carl Zweben, Editors, Proc Proceedings of SPIE Vol. 3786, , Denver, CO, SPIE—The International Society for Optical Engineering, Bellingham, WA, pp. 22-35, July 1999.
- Ungar, E. E., D. H. Sturz, and H. Amick, “Vibration Control Design of High Technology Facilities,” Sound and Vibration (Jul. 1990).
- M. Gendreau and H. Amick, “Micro-Vibration and Noise,” Chapter 29 in Semiconductor Manufacturing Handbook, Hwaiyu Geng, editor, McGraw-Hill, 2005
- American Society of Heating, Refrigerating and Air-Conditioning Engineers, ASHRAE 2003, “Chapter 47: Sound and Vibration Control,” 2003 ASHRAE Handbook: Heating, Ventilating, and Air-Conditioning Applications, ASHRAE, Atlanta, GA, 2003.
- International Standards Organization, ISO 2631 “Mechanical vibration and shock – Evaluation of human exposure to whole-body vibration, Parts 1 and 2.” Part 1 was updated 15 July 1997 and Part 2 was updated 1 April 2003.
- Amick, H., “On Generic Vibration Criteria for Advanced Technology Facilities: with a Tutorial on Vibration Data Representation,” J. Institute of Environmental Sciences, pp. 35-44, (Sept/Oct, 1997).
- Gendreau, M. and H. Amick, “’Maturation’ of the Vibration Environment in Advanced Technology Facilities,” Proc. ESTECH 2004, 50th Annual Technical Meeting, Institute of Environmental Sciences and Technology (IEST), Las Vegas, Nevada, April 28, 2004
- H. Amick, M. Gendreau, and T. Xu, “On the Appropriate Timing for Facility Vibration Surveys,” Semiconductor Fabtech, No. 25, March 2005, Cleanroom Section.
- H. Amick and A. Bayat, “Meeting The Vibration Challenges Of Next-Generation Photolithography Tools,” Proc. ESTECH 2001, 47th Annual Technical Meeting, IEST, Phoenix, Arizona (April 2001).
Footnotes
-
Internal isolation comes in three basic forms. “Passive” internal isolation (usually air springs) can increase the sensitivity of the equipment at low frequencies, with the goal of reducing sensitivity at high frequencies. “Active” isolation is entirely electronic, and relies on an actuator with a control system. It is most effective at relatively low frequencies. “Active-Passive” isolation combines the two technologies, using active isolation to cancel the low-frequency vibration associated with the airspring, producing better performance over a wider frequency range. ↑
-
Carrying out statistical operations on levels expressed in decibels produces the same results as operations in log space. The latter is simply a more general format for definition. ↑
H. Amick, M. Gendreau, T. Busch, and C. Gordon, “Evolving criteria for research facilities: vibration,” Proceedings of SPIE Conference 5933: Buildings for Nanoscale Research and Beyond, San Diego, CA, 31 Jul 2005 to 1 Aug 2005
44d609bb11d5dcb09234940945e5c6a7