
ABSTRACT
Semiconductor fabrication facilities contain many vibration sensitive instruments which are often in close proximity to large vibration sources. A good structural system and proper vibration isolation of mechanical equipment is required to minimize the impact from sources such as pumps, fans, piping, and ducts within the building. This paper presents a case study and lessons learned from the investigation of a 16 Hz tonal vibration which exceeded the vibration criterion on a small area of the fabrication floor. Many of the obvious sources of vibration were identified and evaluated but were found not to be the cause. Further investigations outside the building eventually located the vibration source as a large blast gate that was rattling within a large exhaust duct. This source was over 400 ft away from the vibration sensitive location and was able to transmit to this location along the ductwork attached to the building. The areas between the source and sensitive receiver did not exhibit any unusual characteristics so it was surprising to find that a source so far away was able to make a localized impact on the vibration sensitive floor.
1 INTRODUCTION
In addition to being extremely vibration sensitive, the semiconductor fabrication (fab) process also requires an extremely clean environment. Because of this, the production floor must also be a cleanroom. In this particular building, the cleanroom layout consists of a pressure plenum above the cleanroom and a clean subfab below as shown in Fig. 1. Clean air is blown into the pressure plenum from recirculation air handlers (RAH). From there, the high pressure forces the air down through HEPA filters into the cleanroom which flows downward through openings in the process floor into the subfab level below. The air in the subfab, which may not be as clean as before, is returned up air shafts back to the recirculation air handlers where it is filtered and recycled.
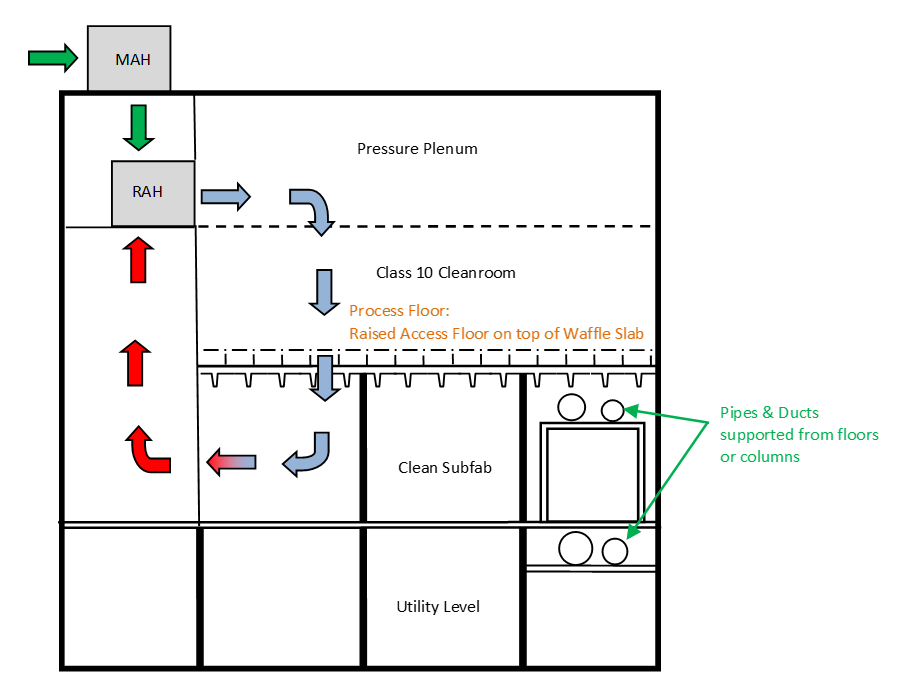
This layout requires that the process floor be very stiff in order to suppress the building vibrations, whilst allowing for penetrations for the cleanroom air to flow through into the subfab. The production floor therefore is usually of a concrete waffle slab design comprised of deep ribs forming a waffle pattern with circular openings in the concrete slab between the ribs. People would then walk on the raised access floor (which is also perforated) set on top of the structural floor. In terms of vibration performance, the structural floor is required to meet the VC-D (6.25 µm/s) criterion1 when the building systems become operational.
During the commissioning of a new tool platform in the cleanroom, vibration measurements were carried out to document the ambient vibrations on the process floor. A distinct 16 Hz tone was measured at a location on the process floor which exceeded the VC-D criterion. This is not completely unusual, as prior experiences have shown that unbalanced or poorly isolated mechanical equipment such as pumps and fans can generate significant tonal vibrations on the process floor. Typically, the offending piece of equipment can be identified based on matching of rotational speeds to the tone; thus allowing for mitigation either through equipment balancing/alignment or proper vibration isolation.
However, in this particular case study, an investigation of “the usual suspects” of nearby mechanical equipment did not yield an obvious suspect source. Thus, the zone of investigation had to be expanded to the perimeters of the building, and ultimately to outside the building. This paper will present the troubleshooting methods that were employed to ultimately locate the source of the 16 Hz tonal vibration, and the mitigation measures that would be required to mitigate this source.
2 Identification of The Problem
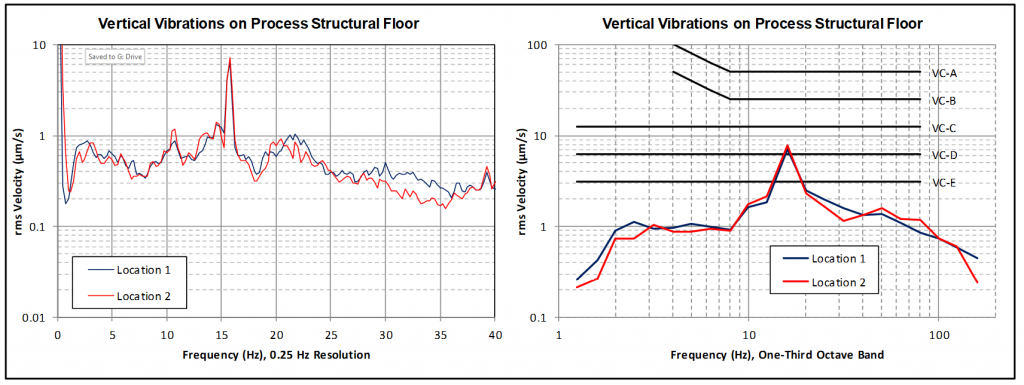
The 16 Hz tone was first discovered while measuring vibrations on a tool platform and on the process floor directly below it. Figure 2 shows the narrowband and 1/3 octave band RMS vibration velocity spectra in the vertical axis at two locations on the structural floor near the tool platform. The 16 Hz tone is very clear in the narrowband spectra, and the 1/3 octave band spectra show that the vibrations exceed the VC-D threshold in the 16 Hz 1/3 octave band.
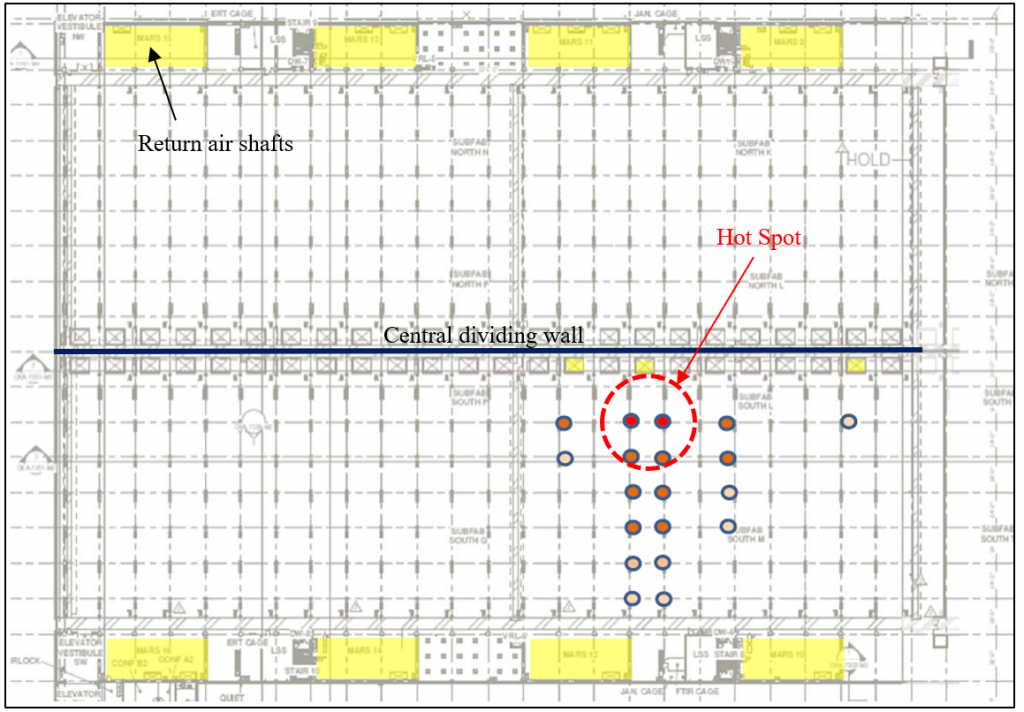
The same tonal vibration was also present on the subfab floor directly below. Additional measurements were carried out on the subfab level because it was easier to access; and a mapping of the severity of tonal vibration can be seen in the layout in Fig. 3. Here one can see that the tone was generally isolated to a few bays near the center of the building. Based on these measurements, we believed we had identified the “hot spot” for the vibration.
3 Potential Vibration Sources
This 16 Hz tone could be due to a number of different vibration sources in the building. Most of these vibration sources can be categorized as either tonal or broadband in nature.
3.1 Tonal Sources
The most direct type of vibration source would be reciprocating or rotating equipment which oscillate at a rate corresponding with the 16 Hz tone (e.g. 16 cycles/second or 960 revolutions/minute (rpm), including nth order harmonics). There are many large pumps and fans in the building, all with motors that rotate at mostly fixed speeds. Therefore, one could simply try and find rotating mechanical equipment with a matching rotational speed.
3.2 Broadband Sources
Broadband vibration sources in the building include liquid and gas flows in pipes and ducts. The production tools in the facility require significant amounts of water for cooling and other purposes, so there are process water pipes distributed all over the building, some as large as 36 inches in diameter. In addition, volatile gases from the production tools also need to be exhausted quickly, so there are large exhaust ducts distributed through the building as well. These exhaust ducts can be as large as 120 inches in diameter. While the flows themselves would not generate a 16 Hz tone, they have the ability to excite structural resonances in the building which may occur at this frequency. This includes resonances in the concrete floor structure as well as pipe and duct support structures.
4 Initial Investigations and Results
The first set of investigations were aimed at trying to locate rotating mechanical equipment with corresponding frequencies. A review of the building’s mechanical layout did not show any large rotating equipment in the direct vicinity of the “hot spot”. The closest pieces of large rotating equipment were some process water pumps in the utility level but on the other side of the central dividing wall. These pumps were found to be operating at 1800 rpm, and thus did not correlate with the 16 Hz tone. Other systems like the recirculation air handlers on the fan deck also did not match in frequency. We even carried out a walkthrough inspection of the building for any temporary equipment that may have been brought in by contractors and did not find anything of significance.
Next, we turned our attention to the large ducts and pipes that are supported on pipe racks off of the subfab level below the problem area. Of particular interest were the very large ducts that come up from the utility level onto the subfab level. These ducts come up through large rectangular penetrations in the subfab floor near the central wall in a line running east to west. These penetrations can be seen in the layout in Fig. 3. Figure 4 shows a picture of one of these penetrations. Each penetration allows for up to 4 large round exhaust duct risers to pass through the subfab floor, with each duct serving a specific exhaust function. The exhaust ducts lead back down into the utility level where they connect to larger duct mains, which then lead out of the building to the large exhaust fans on the adjacent, but structurally independent, steel support structure. The flow velocities in these exhaust ducts are quite high and can generate significant amounts of vibration. In the case of the largest ducts, these were already mounted on spring isolation.
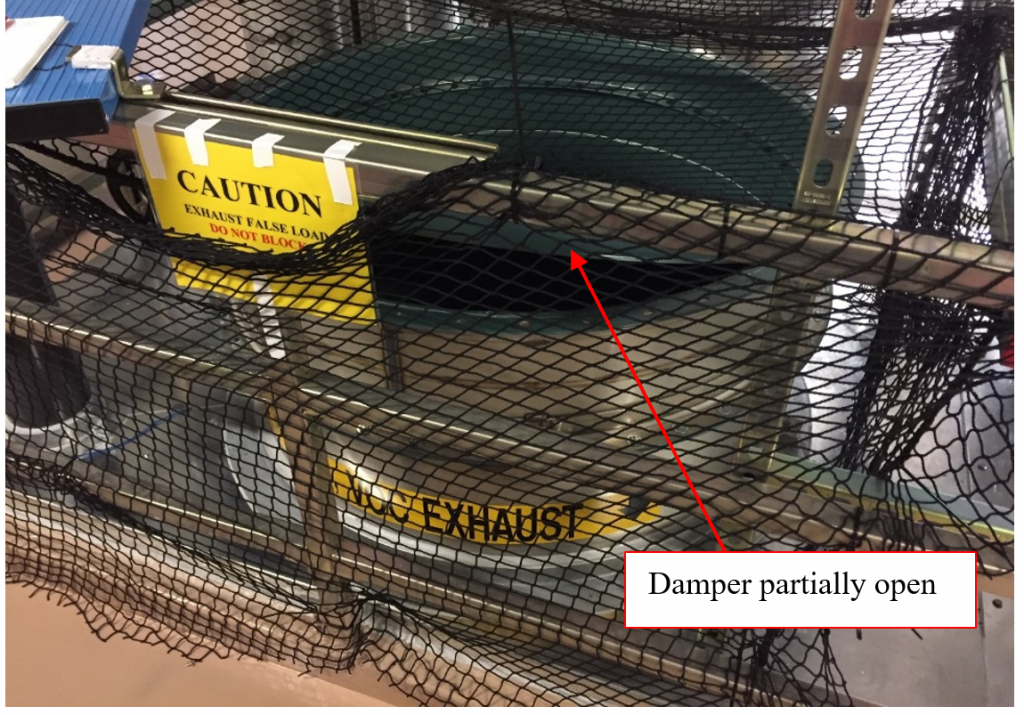
What made the penetration in the “hot spot” unique was that the EXVO (volatile organic compound exhaust) duct, which terminated in the subfab, was not capped like in the adjacent penetrations. Instead, there was a damper (butterfly valve) which was partially open. This was done to exhaust air from the subfab and act as a temporary false load for the exhaust fans outside until the remaining ductwork upstream could be installed. This partial opening resulted in significant airflow noise and duct vibration. Measurements on the duct collar showed the 16 Hz tone as the dominant vibration on the duct. Measurements on the duct collars of the other two exhaust ducts at this penetration (EXGF and EXSC) did not show the 16 Hz tone as the largest tone. Therefore, at this point we believed we had at least found the system that was the source of the 16 Hz tone: the EXVO duct system.
Interestingly, there were two other floor penetrations with similar partially open EXVO ducts nearby. These are shown as the small yellow boxes near the central dividing wall in Fig. 3. On these other two EXVO duct collars, we also measured very large 16 Hz tones. However, there was not a corresponding large 16 Hz tone on the subfab floor at those locations. The question then became: what is unique about the problematic penetration?
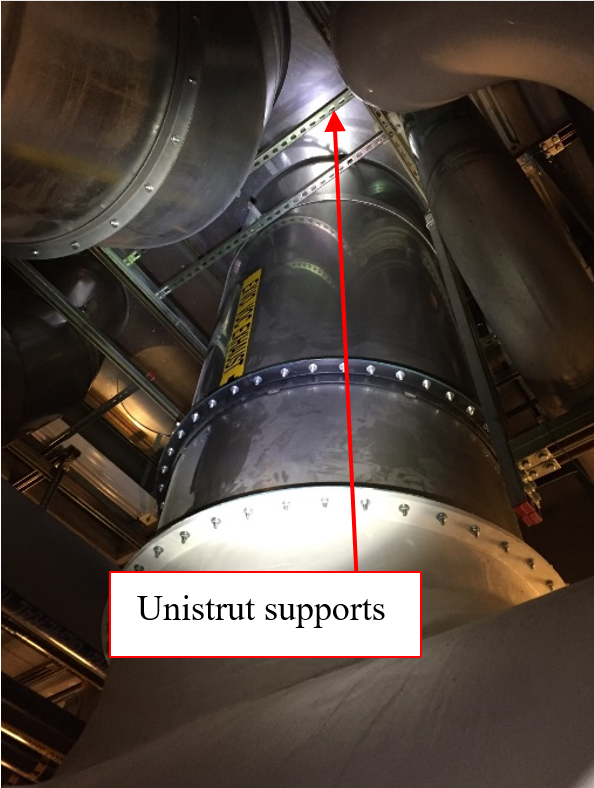
One element that may have been unique was the duct riser supports. Each duct riser is supported at the penetration by Unistrut framing underneath the floor slab. This framing is fabricated in the field, so each penetration could have slightly different conditions. Closer inspection of these Unistrut supports revealed that the duct risers were actually supported on spring hangers off of the Unistrut. At this particular “hot spot” penetration however, the springs had not yet been released so the duct was effectively being rigidly supported from the Unistrut.
Additionally, we found that on the utility level, there was a large T section in the main EXVO duct header directly below the problem area. The bottom section of the T leads into a tunnel which runs north and out of the building. This T section is supported on springs at each corner, and an inspection of these springs showed that they were bottomed out (i.e. over-compressed), so they were in effect, rigid supports as well. Figure 5 shows the Unistrut support and the T section spring supports.
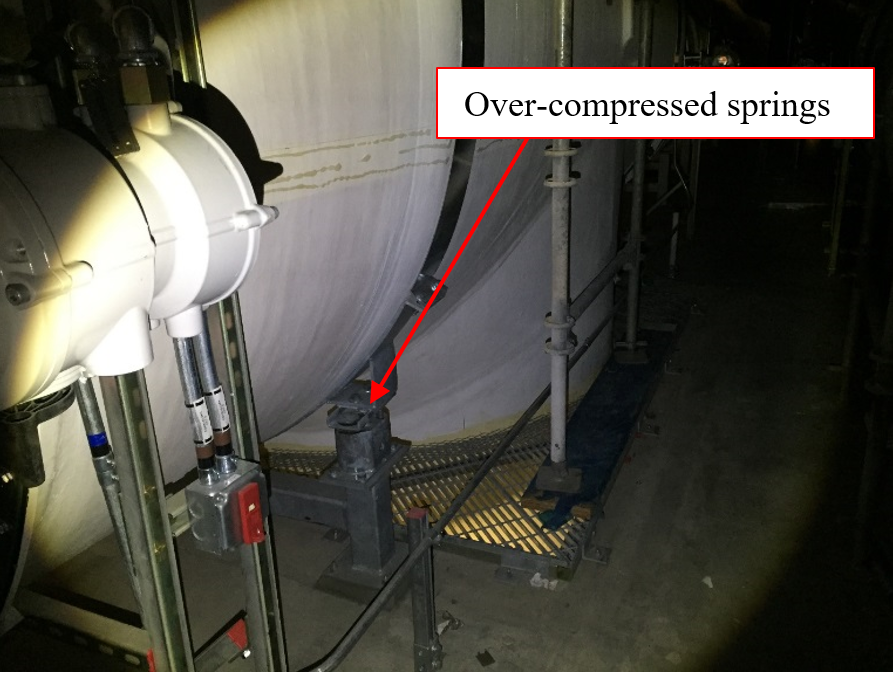
It became very clear then that the large 16 Hz vibrations on the EXVO duct were being transmitted to the utility and subfab floor structures due to the poor condition of the spring isolators. The springs were ultimately re-adjusted, and this helped reduce the vibrations on the process floor. However, the vibration was still above the VC-D limit and we still did not know where the 16 Hz tone originated from at this point.
5 Follow Up Investigations and Results
We started to look along the ductwork back out to the exterior of the building. We measured along the length of the EXVO duct, following it through a tunnel at the bottom of the building, out the exterior wall, into the structurally isolated adjacent building, and up the steel-framed support structure. The 16 Hz tone was measured in the duct for its full length, for more than 400 feet away from the process floor problem location. Furthermore, the 16 Hz tone was also present in the steel support structure itself.
The steel support structure was of particular interest because this is where all of the large exhaust fans are located. The EXVO fans serving this portion of the building were not online yet at the time of the investigation, so this problematic EXVO duct was connected to a header that led to an existing set of operating EXVO fans at the east end of the steel support structure as shown in Fig. 6. An experiment was carried out in which the fan speeds for two of these fans were adjusted (one increased and one decreased) to see if we could affect a change in the 16 Hz vibration on the process floor and this was found to have no effect.
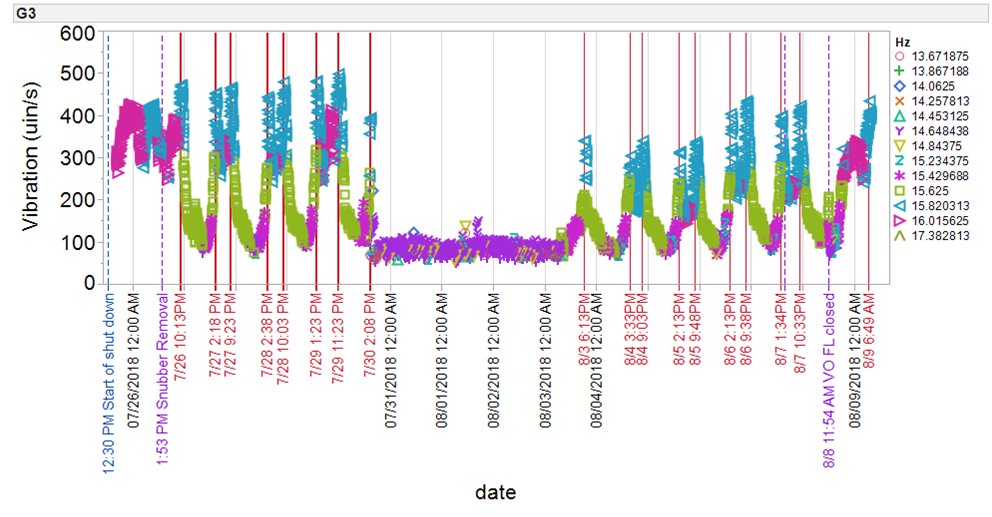
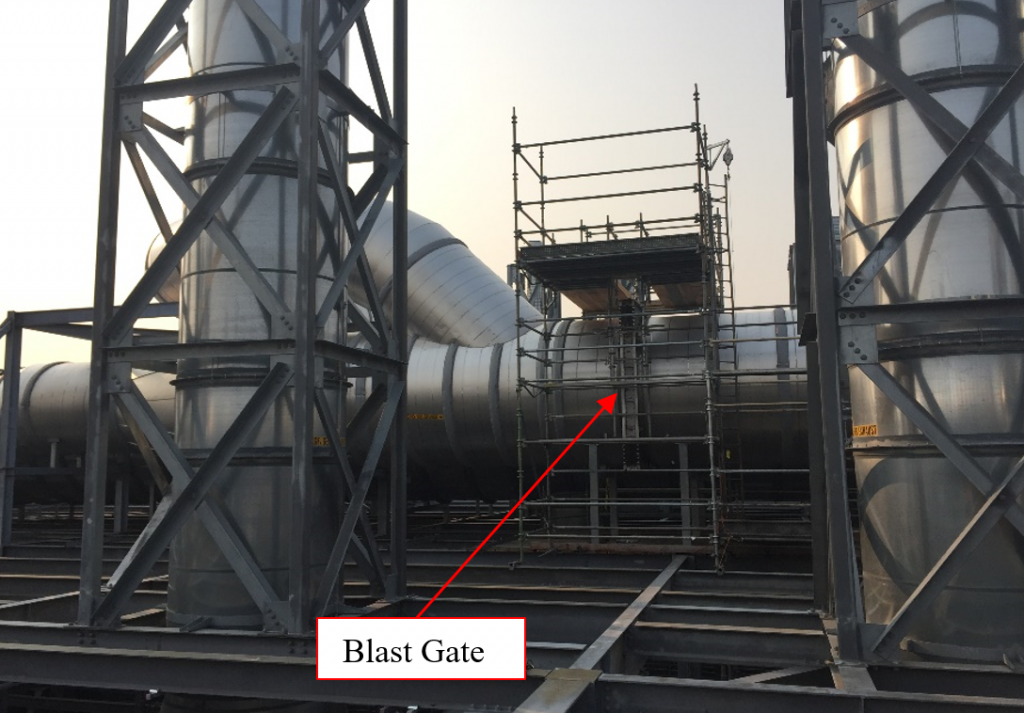
Focus then shifted to an examination of all of the other moving parts, including dampers and blast gates in this EXVO duct system. First, the dampers throughout the system inside the factory were measured and varied, with no change in vibration response. Finally, attention turned to the blast gate on top of the steel structure shown in Fig. 6. The blast gate separated two sections of duct from each other – one was live (at lower than atmospheric pressure, to draw exhaust out of the factory) while the other was not. Continuous vibration monitoring was set up on the process floor and it was found that the amplitude of the 16 Hz tone changed throughout the day on most days, producing a distinct diurnal cycle; however, there were also times that the tone disappeared completely as seen in Fig. 7. The times of the disappearance of the tone correlated to a change in fan setup that resulted in a balance in pressure on both sides of the blast gate. Therefore, it was time to take a closer look at the blast gate.
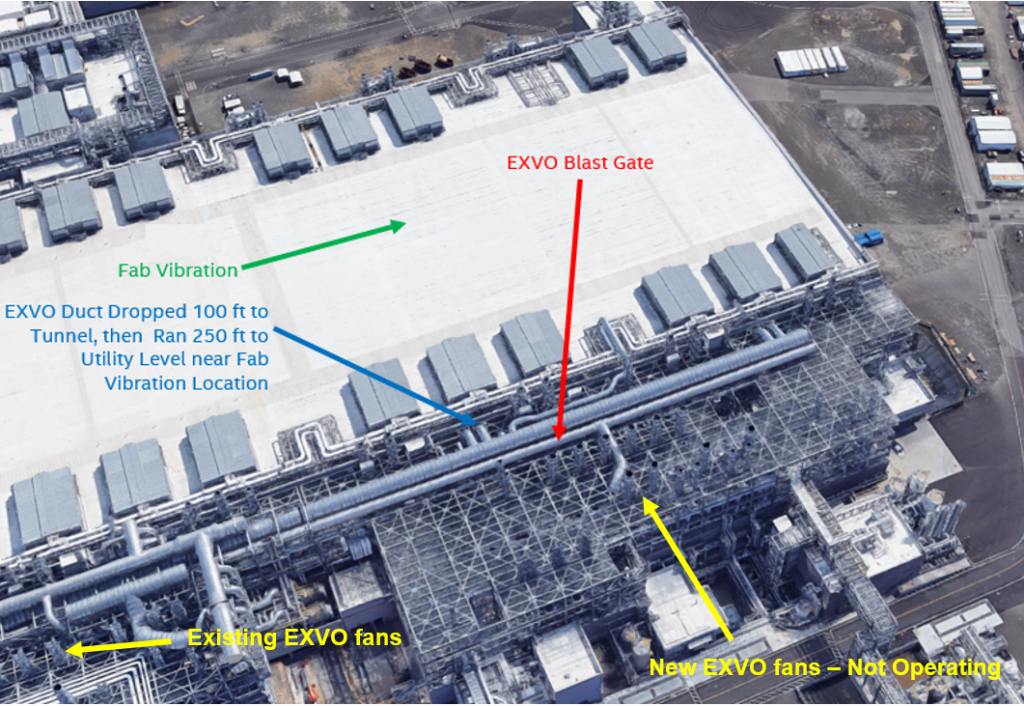
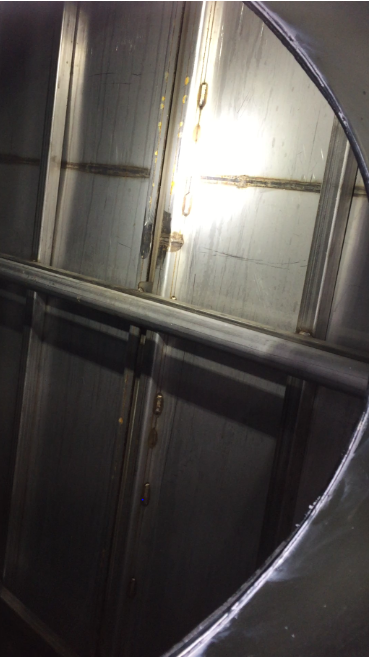
Scaffolding was erected on the top level of the steel structure, allowing access to the blast gate as shown in Fig. 8. Once at the level of the blast gate, a loud rattling sound was evident that was not previously perceptible from below, due to nearby fans whose noise masked the blast gate ratting. Upon measuring the blast gate vibration, the 16 Hz tone was present in the largest magnitude measured throughout the entire investigation – over 2500 µm/s. The gate rattling decreased significantly when the pressure imbalance on the two sides was equalized. This vibration would ultimately be eliminated by inserting shims between the blast gate and the support frame so that there would be no travel in the blast gate during times of unequal pressure.
6 Conclusions
This case study showed that a large negative pressure on one side of a blast gate was able to force it into vibration with a resonant behavior, resulting in a large 16 Hz tone. This vibration was able to propagate over 400 ft into the fab building along the ductwork and cause an exceedance of the vibration design criterion on the production floor. Initial attempts to identify this vibration source ruled out many of the “usual suspects” such as rotating mechanical equipment. Further study of the duct support conditions, and ultimately a section of the duct well outside the building, was required to eventually locate the blast gate source. Measurements made purely on the building structure would not have located the source because the 16 Hz tone actually decreased in the direction towards the real source.
7 References
- C. Gordon “Generic Criteria for Vibration-Sensitive Equipment”, Vibration Control in Microelectronics, Optics and Metrology, SPIE Proceedings Volume 1619, pp. 71-85, San Jose, CA (Nov. 1991)).
Blong Xiong
Colin Gordon Associates
1350 Old Bayshore Hwy, Ste 799
Burlingame, CA 94010
blong.xiong@colingordon.com
Marc Sokol
Intel Corporation
2501 NE Century Blvd
Hillsboro, OR 97214
marc.a.sokol@intel.com